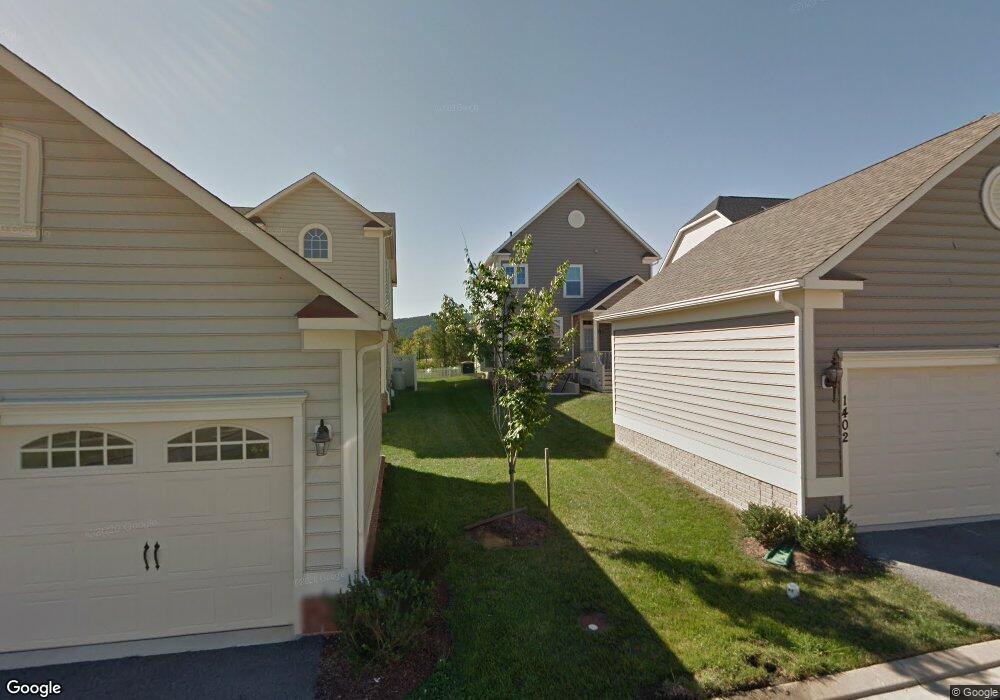
1402 Musgrove Alley Brunswick, MD 21716
Estimated Value: $531,000 - $553,926
--
Bed
1
Bath
1,984
Sq Ft
$272/Sq Ft
Est. Value
About This Home
This home is located at 1402 Musgrove Alley, Brunswick, MD 21716 and is currently estimated at $539,482, approximately $271 per square foot. 1402 Musgrove Alley is a home located in Frederick County with nearby schools including Brunswick Elementary School, Brunswick Middle School, and Brunswick High School.
Ownership History
Date
Name
Owned For
Owner Type
Purchase Details
Closed on
May 5, 2022
Sold by
Sprenkle Kristin A
Bought by
Bates Christopher A
Current Estimated Value
Home Financials for this Owner
Home Financials are based on the most recent Mortgage that was taken out on this home.
Original Mortgage
$451,250
Outstanding Balance
$428,754
Interest Rate
5.27%
Mortgage Type
New Conventional
Estimated Equity
$110,728
Purchase Details
Closed on
Jul 26, 2012
Sold by
Peterson Kristin A and Pearrell Richard A
Bought by
Peterson Kristin A and Pearrell Richard A
Purchase Details
Closed on
Nov 29, 2010
Sold by
Nvr Inc
Bought by
Peterson Kristin A
Home Financials for this Owner
Home Financials are based on the most recent Mortgage that was taken out on this home.
Original Mortgage
$303,316
Interest Rate
4.75%
Mortgage Type
FHA
Purchase Details
Closed on
Jul 20, 2010
Sold by
Brunswick Crossing Llc
Bought by
Nvr Inc
Create a Home Valuation Report for This Property
The Home Valuation Report is an in-depth analysis detailing your home's value as well as a comparison with similar homes in the area
Home Values in the Area
Average Home Value in this Area
Purchase History
| Date | Buyer | Sale Price | Title Company |
|---|---|---|---|
| Bates Christopher A | $475,000 | None Listed On Document | |
| Peterson Kristin A | -- | Guaranteed Trust Title Llc | |
| Peterson Kristin A | $319,010 | -- | |
| Nvr Inc | $71,000 | -- |
Source: Public Records
Mortgage History
| Date | Status | Borrower | Loan Amount |
|---|---|---|---|
| Open | Bates Christopher A | $451,250 | |
| Previous Owner | Peterson Kristin A | $303,316 |
Source: Public Records
Tax History Compared to Growth
Tax History
| Year | Tax Paid | Tax Assessment Tax Assessment Total Assessment is a certain percentage of the fair market value that is determined by local assessors to be the total taxable value of land and additions on the property. | Land | Improvement |
|---|---|---|---|---|
| 2025 | $7,520 | $402,933 | -- | -- |
| 2024 | $7,520 | $361,100 | $60,700 | $300,400 |
| 2023 | $7,094 | $347,300 | $0 | $0 |
| 2022 | $6,848 | $333,500 | $0 | $0 |
| 2021 | $6,518 | $319,700 | $60,700 | $259,000 |
| 2020 | $6,492 | $310,867 | $0 | $0 |
| 2019 | $6,267 | $302,033 | $0 | $0 |
| 2018 | $4,668 | $293,200 | $60,700 | $232,500 |
| 2017 | $6,020 | $293,200 | $0 | $0 |
| 2016 | $5,800 | $286,267 | $0 | $0 |
| 2015 | $5,800 | $282,800 | $0 | $0 |
| 2014 | $5,800 | $282,800 | $0 | $0 |
Source: Public Records
Map
Nearby Homes
- 1315 Hope Farm Ct
- 1007 Shenandoah View Pkwy
- Emory II Plan at Brunswick Crossing - Single Family Homes - Signature Series
- New Haven II Plan at Brunswick Crossing - Single Family Homes - Signature Series
- Albemarle Plan at Brunswick Crossing - Single Family Homes - Signature Series
- Bridgeport II Plan at Brunswick Crossing - Single Family Homes - Signature Series
- Orchid Plan at Brunswick Crossing - Villas
- Dahlia Plan at Brunswick Crossing - Villas
- Cumberland II Plan at Brunswick Crossing - Single Family Homes - Signature Series
- Regent II Plan at Brunswick Crossing - Single Family Homes - Signature Series
- Oakdale II Plan at Brunswick Crossing - Single Family Homes
- TBB Brandenburg Farm Ct Unit ALBEMARLE
- 1305 Moore Spring Ct
- 1011 Monocacy Crossing Pkwy
- TBB Monocacy Crossing Pkwy Unit REGENT II
- TBB Monocacy Crossing Pkwy Unit BRIDGEPORT
- TBB Monocacy Crossing Pkwy Unit NEW HAVEN
- TBB Enfield Farm Ln Unit CUMBERLAND II
- TBB Enfield Farm Ln Unit EMORY II
- TBB Enfield Farm Ln Unit OAKDALE II
- 1400 Musgrove Alley
- 1404 Musgrove Alley
- 1406 Musgrove Alley
- 1410 Musgrove Alley
- 1403 Hope Farm Ct
- 1401 Hope Farm Ct
- 1405 Hope Farm Ct
- 1407 Hope Farm Ct
- 1412 Musgrove Alley
- 1409 Hope Farm Ct
- 1414 Musgrove Alley
- 0 Hope Farm Ct Unit 1004709088
- 1411 Hope Farm Ct
- 1313 Hope Farm Ct
- 1416 Musgrove Alley
- 1413 Hope Farm Ct
- 1316 Hope Farm Ct
- 1400 Hope Farm Ct
- 1000 Potomac View Pkwy
- 1311 Hope Farm Ct