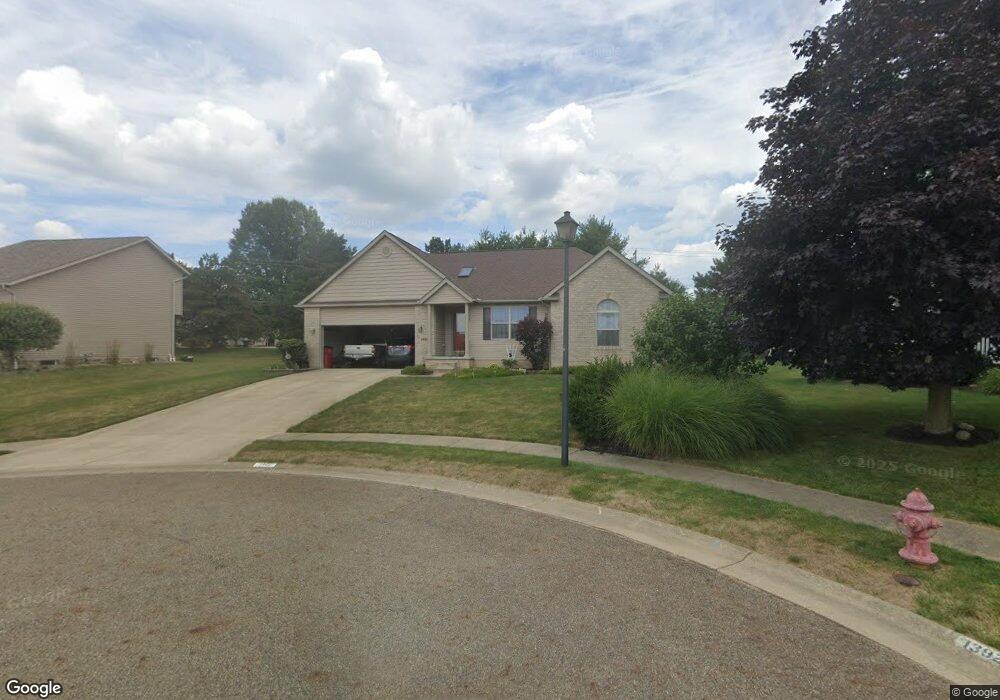
1402 Umberto Ct Louisville, OH 44641
Estimated Value: $277,000 - $299,688
3
Beds
3
Baths
1,562
Sq Ft
$188/Sq Ft
Est. Value
About This Home
This home is located at 1402 Umberto Ct, Louisville, OH 44641 and is currently estimated at $293,422, approximately $187 per square foot. 1402 Umberto Ct is a home located in Stark County with nearby schools including Louisville High School and St. Thomas Aquinas High School & Middle School.
Ownership History
Date
Name
Owned For
Owner Type
Purchase Details
Closed on
May 20, 2009
Sold by
Zimmer Zachary A and Zimmer Kelly K
Bought by
Sanders Roger N and Sanders Gail A
Current Estimated Value
Home Financials for this Owner
Home Financials are based on the most recent Mortgage that was taken out on this home.
Original Mortgage
$85,000
Interest Rate
4.9%
Mortgage Type
Purchase Money Mortgage
Purchase Details
Closed on
Oct 5, 2005
Sold by
Hostetler & Son Builders Inc
Bought by
Zimmer Zachary A
Home Financials for this Owner
Home Financials are based on the most recent Mortgage that was taken out on this home.
Original Mortgage
$156,600
Interest Rate
5.88%
Mortgage Type
Fannie Mae Freddie Mac
Purchase Details
Closed on
Jan 26, 2000
Sold by
Brienza Gino D & Filomena Trustees
Bought by
Hostetler & Son Builders Inc
Create a Home Valuation Report for This Property
The Home Valuation Report is an in-depth analysis detailing your home's value as well as a comparison with similar homes in the area
Home Values in the Area
Average Home Value in this Area
Purchase History
| Date | Buyer | Sale Price | Title Company |
|---|---|---|---|
| Sanders Roger N | $173,000 | Attorney | |
| Zimmer Zachary A | $174,000 | -- | |
| Hostetler & Son Builders Inc | $28,000 | -- |
Source: Public Records
Mortgage History
| Date | Status | Borrower | Loan Amount |
|---|---|---|---|
| Closed | Sanders Roger N | $85,000 | |
| Previous Owner | Zimmer Zachary A | $156,600 |
Source: Public Records
Tax History Compared to Growth
Tax History
| Year | Tax Paid | Tax Assessment Tax Assessment Total Assessment is a certain percentage of the fair market value that is determined by local assessors to be the total taxable value of land and additions on the property. | Land | Improvement |
|---|---|---|---|---|
| 2025 | -- | $90,550 | $23,280 | $67,270 |
| 2024 | -- | $90,550 | $23,280 | $67,270 |
| 2023 | $2,677 | $71,470 | $16,450 | $55,020 |
| 2022 | $2,701 | $71,470 | $16,450 | $55,020 |
| 2021 | $2,709 | $71,470 | $16,450 | $55,020 |
| 2020 | $2,165 | $63,180 | $14,810 | $48,370 |
| 2019 | $2,174 | $59,610 | $9,070 | $50,540 |
| 2018 | $2,024 | $59,610 | $9,070 | $50,540 |
| 2017 | $1,836 | $53,270 | $8,540 | $44,730 |
| 2016 | $2,241 | $53,270 | $8,540 | $44,730 |
| 2015 | $2,247 | $53,270 | $8,540 | $44,730 |
| 2014 | $273 | $50,090 | $8,050 | $42,040 |
| 2013 | $1,140 | $50,090 | $8,050 | $42,040 |
Source: Public Records
Map
Nearby Homes
- 0 Brookridge Ave
- 1175 Sturbridge Dr
- 1149 Sturbridge Dr
- 3580 Brookridge Ave Lot 15
- 0 Glenbar St
- 524 Glenbar St
- 300 Kennedy St
- 1561 Noel St
- 428 Honeycrisp Dr NE
- 3047 Mcintosh Dr NE
- 432 Honeycrisp Dr NE
- 2962 Mcintosh Dr NE
- 2963 Mcintosh Dr NE
- 430 Honeycrisp Dr NE
- 2957 Mcintosh Dr NE
- 5474 Ravenna Ave
- 248 Menegay Rd
- 316 E Reno Dr
- 344 E Reno Dr
- 201 Indiana Ave
- 1392 Umberto Ct
- 1414 W Chester Dr
- 6811 Reno Dr
- 1378 Umberto Ct
- 1424 W Chester Dr
- 1424 W Chester Dr
- 6858 Reno Dr
- 1364 W Chester Dr
- 1421 W Chester Dr
- 1438 W Chester Dr
- 6755 Reno Dr
- 6873 Reno Dr
- 1361 W Chester Dr
- 1437 W Chester Dr
- 1354 W Chester Dr
- 0 Reno Dr NE
- 6900 Reno Dr
- 6880 Reno Dr
- 1393 Filomena Cir
- 1351 W Chester Dr