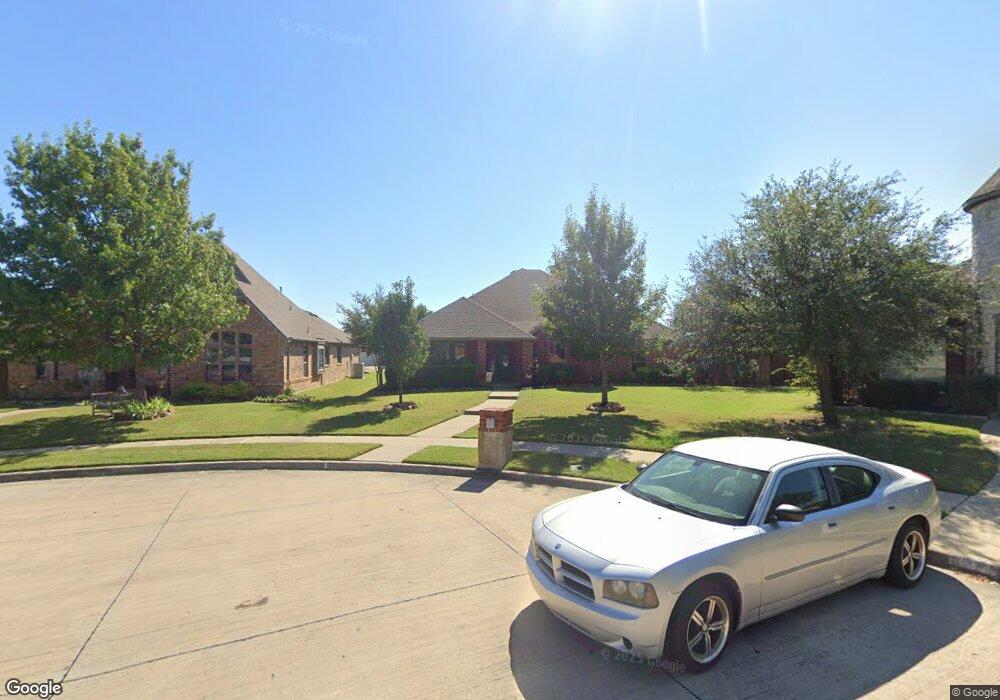
1404 Eagle Point Royse City, TX 75189
Estimated Value: $383,000 - $431,000
4
Beds
3
Baths
2,833
Sq Ft
$142/Sq Ft
Est. Value
About This Home
This home is located at 1404 Eagle Point, Royse City, TX 75189 and is currently estimated at $403,597, approximately $142 per square foot. 1404 Eagle Point is a home located in Collin County with nearby schools including Davis Elementary School, Ruth Cherry Elementary School, and Ouida Bailey Middle School.
Ownership History
Date
Name
Owned For
Owner Type
Purchase Details
Closed on
Feb 11, 2020
Sold by
Shew Andy and Shew Ana C
Bought by
Cox Casey D
Current Estimated Value
Home Financials for this Owner
Home Financials are based on the most recent Mortgage that was taken out on this home.
Original Mortgage
$254,000
Outstanding Balance
$215,568
Interest Rate
3.72%
Mortgage Type
Purchase Money Mortgage
Estimated Equity
$188,029
Purchase Details
Closed on
Feb 15, 2005
Sold by
David Besser Homes Llc
Bought by
Shew Andy and Shew Ana C
Home Financials for this Owner
Home Financials are based on the most recent Mortgage that was taken out on this home.
Original Mortgage
$84,346
Interest Rate
5.77%
Purchase Details
Closed on
Nov 16, 2004
Sold by
Whittle Development Inc
Bought by
David Besser Homes Llc
Home Financials for this Owner
Home Financials are based on the most recent Mortgage that was taken out on this home.
Original Mortgage
$149,244
Interest Rate
5.72%
Mortgage Type
Purchase Money Mortgage
Create a Home Valuation Report for This Property
The Home Valuation Report is an in-depth analysis detailing your home's value as well as a comparison with similar homes in the area
Home Values in the Area
Average Home Value in this Area
Purchase History
| Date | Buyer | Sale Price | Title Company |
|---|---|---|---|
| Cox Casey D | -- | Capital Title | |
| Shew Andy | -- | Stnt | |
| David Besser Homes Llc | -- | Stnt |
Source: Public Records
Mortgage History
| Date | Status | Borrower | Loan Amount |
|---|---|---|---|
| Open | Cox Casey D | $254,000 | |
| Previous Owner | Shew Andy | $84,346 | |
| Previous Owner | David Besser Homes Llc | $149,244 |
Source: Public Records
Tax History Compared to Growth
Tax History
| Year | Tax Paid | Tax Assessment Tax Assessment Total Assessment is a certain percentage of the fair market value that is determined by local assessors to be the total taxable value of land and additions on the property. | Land | Improvement |
|---|---|---|---|---|
| 2025 | $6,552 | $370,832 | $96,000 | $274,832 |
| 2024 | $6,552 | $382,891 | $96,000 | $302,113 |
| 2023 | $6,552 | $348,083 | $96,000 | $305,794 |
| 2022 | $7,220 | $316,439 | $90,000 | $291,161 |
| 2021 | $6,706 | $287,672 | $66,000 | $221,672 |
| 2020 | $6,894 | $281,839 | $66,000 | $215,839 |
| 2019 | $7,197 | $281,839 | $66,000 | $215,839 |
| 2018 | $6,805 | $265,451 | $66,000 | $210,236 |
| 2017 | $6,186 | $251,808 | $60,000 | $191,808 |
| 2016 | $5,784 | $219,381 | $60,000 | $159,381 |
| 2015 | $572 | $212,485 | $48,000 | $164,485 |
Source: Public Records
Map
Nearby Homes
- 204 High Meadow Ct
- 209 Midnight Dr
- 1201 Lost Valley Dr
- 1316 Waco Turner
- 1813 Meadow Lark Ln
- 803 Trough St
- 5635 Huffines Blvd
- 2110 Bailer Way
- 803 Sunrise Ln
- 503 Long Prairie Dr
- 918 Wood St
- 1213 Houston Place
- 519 Long Prairie Dr
- 917 Wood St
- 208 W County Line Rd
- 1116 Walnut St
- 1017 N Houston St
- 704 Peterson St
- 1008 Walnut St
- 1701 Fair Oaks Ln
- 1408 Eagle Point
- 721 Fossil Grove Dr
- 516 Vasant Dr
- 729 Fossil Grove Dr
- 504 Vasant Dr
- 255 Sun Harvest Dr
- 251 Sun Harvest Dr
- 523 Vasant Dr
- 527 Vasant Dr
- 515 Vasant Dr
- 1400 Eagle Point
- 304 Regal Ct
- 300 Regal Ct
- 1414 Eagle Point
- 310 Regal Ct
- 1401 N Josephine St
- 1405 N Josephine St
- 218 Regal Ct
- 316 Regal Ct
- 1405 Eagle Point