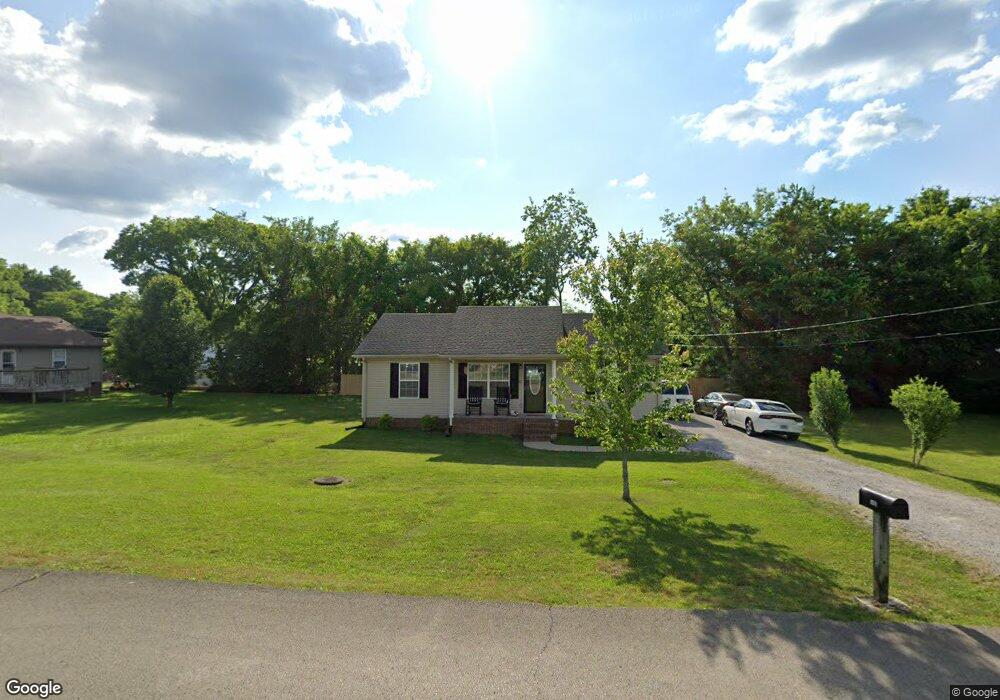
1410 Titan Way Lewisburg, TN 37091
Estimated Value: $211,391 - $263,000
--
Bed
2
Baths
1,025
Sq Ft
$234/Sq Ft
Est. Value
About This Home
This home is located at 1410 Titan Way, Lewisburg, TN 37091 and is currently estimated at $239,598, approximately $233 per square foot. 1410 Titan Way is a home located in Marshall County with nearby schools including Oak Grove Elementary School, Marshall Elementary School, and Westhills Elementary School.
Ownership History
Date
Name
Owned For
Owner Type
Purchase Details
Closed on
Apr 1, 2019
Sold by
Poarch Jeff
Bought by
Kincaid Pamela
Current Estimated Value
Home Financials for this Owner
Home Financials are based on the most recent Mortgage that was taken out on this home.
Original Mortgage
$101,538
Outstanding Balance
$90,688
Interest Rate
5.12%
Mortgage Type
FHA
Estimated Equity
$148,910
Purchase Details
Closed on
Nov 8, 2005
Sold by
Bradley Hooten
Bought by
Wayne Wright and Wayne Angie
Purchase Details
Closed on
Aug 18, 2004
Bought by
Poarch Jeff
Purchase Details
Closed on
Aug 17, 2004
Sold by
Linda Poarch
Bought by
Jeff Poarch
Purchase Details
Closed on
Oct 17, 2003
Sold by
Rex Richardson
Bought by
Jeff Poarch and Jeff Linda
Purchase Details
Closed on
Sep 23, 2003
Sold by
Chris Brothers
Bought by
Rex Richardson
Purchase Details
Closed on
Sep 22, 2003
Bought by
Richardson Rex
Create a Home Valuation Report for This Property
The Home Valuation Report is an in-depth analysis detailing your home's value as well as a comparison with similar homes in the area
Home Values in the Area
Average Home Value in this Area
Purchase History
| Date | Buyer | Sale Price | Title Company |
|---|---|---|---|
| Kincaid Pamela | $105,000 | -- | |
| Wayne Wright | $82,500 | -- | |
| Poarch Jeff | -- | -- | |
| Jeff Poarch | -- | -- | |
| Jeff Poarch | $9,300 | -- | |
| Rex Richardson | $17,593 | -- | |
| Richardson Rex | $17,600 | -- |
Source: Public Records
Mortgage History
| Date | Status | Borrower | Loan Amount |
|---|---|---|---|
| Open | Kincaid Pamela | $101,538 |
Source: Public Records
Tax History Compared to Growth
Tax History
| Year | Tax Paid | Tax Assessment Tax Assessment Total Assessment is a certain percentage of the fair market value that is determined by local assessors to be the total taxable value of land and additions on the property. | Land | Improvement |
|---|---|---|---|---|
| 2024 | -- | $42,925 | $8,750 | $34,175 |
| 2023 | $1,333 | $42,925 | $8,750 | $34,175 |
| 2022 | $1,333 | $42,925 | $8,750 | $34,175 |
| 2021 | $948 | $20,375 | $3,250 | $17,125 |
| 2020 | $948 | $20,375 | $3,250 | $17,125 |
| 2019 | $918 | $20,375 | $3,250 | $17,125 |
| 2018 | $908 | $20,375 | $3,250 | $17,125 |
| 2017 | $908 | $20,375 | $3,250 | $17,125 |
| 2016 | $883 | $17,250 | $2,875 | $14,375 |
| 2015 | $806 | $17,250 | $2,875 | $14,375 |
| 2014 | $806 | $17,250 | $2,875 | $14,375 |
Source: Public Records
Map
Nearby Homes
- 341 Holly Grove Rd
- 1529 Joanne Cir
- 1465 Old Farmington Rd
- 1408 Holly Grove Rd
- 1401 Hobby Ln
- 2998 Verona Caney Rd
- 155 Landon Ln
- 1011 Easy St
- 1019 Curtis Spring Ln
- 380 Baxter Ave
- Ashbury Plan at Spring Valley Estates - Grandview Collection
- Primrose Plan at Spring Valley Estates - Classic Collection
- 1011 Curtis Springs Ln
- Alan Plan at Spring Valley Estates - Grandview Collection
- 1013 Curtis Springs Ln
- 1015 Curtis Springs Ln
- 1019 Curtis Springs Ln
- Rosemary Plan at Spring Valley Estates - Classic Collection
- 3021 Cambridge Ct
- 3019 Cambridge Ct
- 1420 Titan Way
- 1400 Titan Way
- 1411 Titan Way
- 410 Holly Grove Rd
- 1401 Titan Way
- 1421 Titan Way
- 400 Holly Grove Rd
- 1430 Titan Way
- 1431 Titan Way
- 413 Holly Grove Rd
- 432 Holly Grove Rd
- 380 Holly Grove Rd
- 411 Holly Grove Rd
- 1440 Titan Way
- 401 Holly Grove Rd
- 370 Holly Grove Rd
- 421 Holly Grove Rd
- 441 Holly Grove Rd
- 1441 Titan Way
- 381 Holly Grove Rd