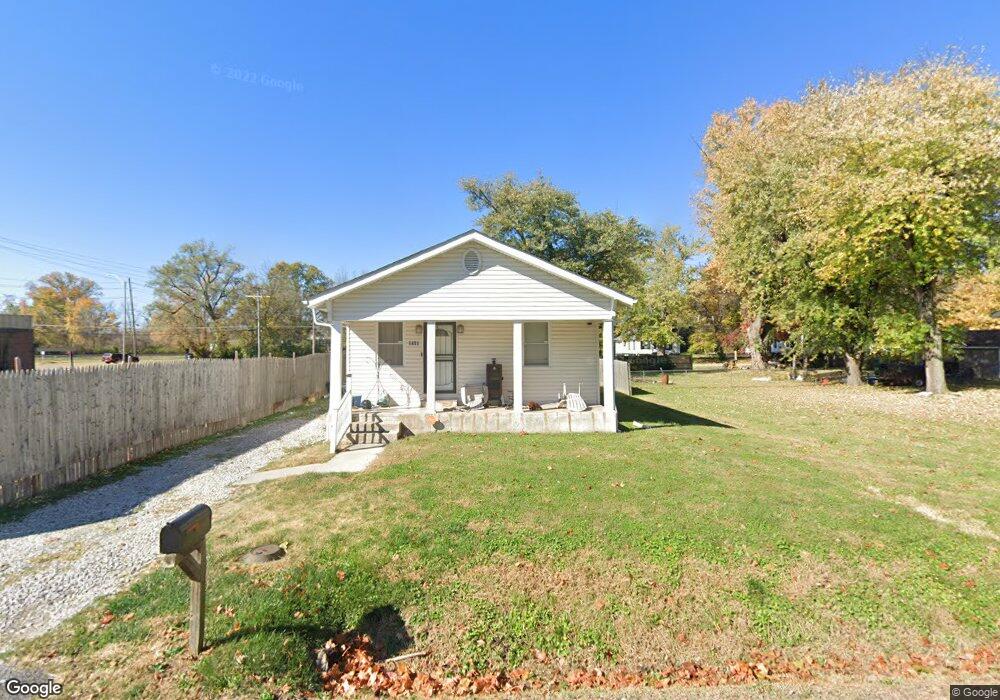
1411 1st Ave Fairview Heights, IL 62208
Estimated Value: $53,589 - $110,000
--
Bed
--
Bath
1,080
Sq Ft
$85/Sq Ft
Est. Value
About This Home
This home is located at 1411 1st Ave, Fairview Heights, IL 62208 and is currently estimated at $91,647, approximately $84 per square foot. 1411 1st Ave is a home located in St. Clair County with nearby schools including Mason/Clark Middle School, James Avant Elementary School, and East St Louis Senior High School.
Ownership History
Date
Name
Owned For
Owner Type
Purchase Details
Closed on
Feb 28, 2011
Sold by
Mcneil Brenda
Bought by
Fisher Voncille
Current Estimated Value
Home Financials for this Owner
Home Financials are based on the most recent Mortgage that was taken out on this home.
Original Mortgage
$63,352
Outstanding Balance
$43,509
Interest Rate
4.78%
Mortgage Type
FHA
Estimated Equity
$48,138
Purchase Details
Closed on
Oct 24, 2008
Sold by
Davinroy Joseph J
Bought by
Mcneil Brenda
Create a Home Valuation Report for This Property
The Home Valuation Report is an in-depth analysis detailing your home's value as well as a comparison with similar homes in the area
Home Values in the Area
Average Home Value in this Area
Purchase History
| Date | Buyer | Sale Price | Title Company |
|---|---|---|---|
| Fisher Voncille | $65,000 | Metro East Title Corporation | |
| Mcneil Brenda | $15,000 | Metro East Title Corporation |
Source: Public Records
Mortgage History
| Date | Status | Borrower | Loan Amount |
|---|---|---|---|
| Open | Fisher Voncille | $63,352 |
Source: Public Records
Tax History Compared to Growth
Tax History
| Year | Tax Paid | Tax Assessment Tax Assessment Total Assessment is a certain percentage of the fair market value that is determined by local assessors to be the total taxable value of land and additions on the property. | Land | Improvement |
|---|---|---|---|---|
| 2024 | $634 | $18,838 | $1,819 | $17,019 |
| 2023 | $654 | $18,359 | $1,773 | $16,586 |
| 2022 | $641 | $16,871 | $1,629 | $15,242 |
| 2021 | $646 | $16,100 | $1,622 | $14,478 |
| 2020 | $638 | $16,184 | $1,631 | $14,553 |
| 2019 | $1,448 | $16,184 | $1,631 | $14,553 |
| 2018 | $1,551 | $16,429 | $1,656 | $14,773 |
| 2017 | $1,705 | $17,235 | $2,443 | $14,792 |
| 2016 | $1,694 | $17,344 | $2,458 | $14,886 |
| 2014 | $1,696 | $17,344 | $2,458 | $14,886 |
| 2013 | $2,030 | $19,918 | $3,032 | $16,886 |
Source: Public Records
Map
Nearby Homes