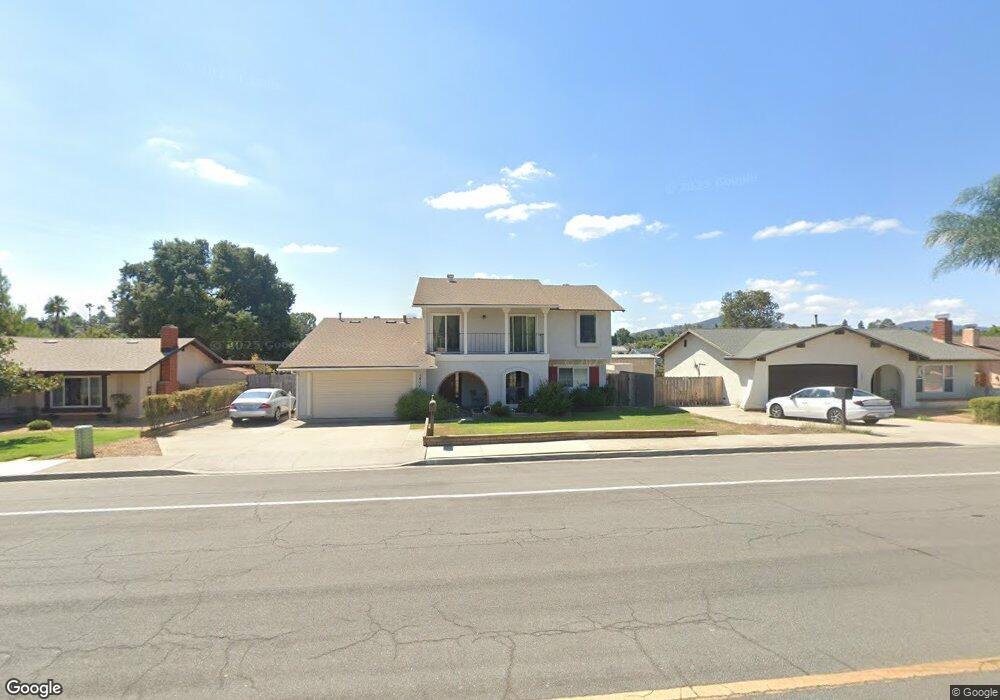
1411 Rock Springs Rd San Marcos, CA 92069
Estimated Value: $931,000 - $980,000
4
Beds
3
Baths
2,071
Sq Ft
$460/Sq Ft
Est. Value
About This Home
This home is located at 1411 Rock Springs Rd, San Marcos, CA 92069 and is currently estimated at $952,112, approximately $459 per square foot. 1411 Rock Springs Rd is a home located in San Diego County with nearby schools including Knob Hill Elementary School, Woodland Park Middle School, and Mission Hills High School.
Ownership History
Date
Name
Owned For
Owner Type
Purchase Details
Closed on
Sep 10, 2021
Sold by
Cox John Robert
Bought by
Cox John R and John R Cox Trust
Current Estimated Value
Home Financials for this Owner
Home Financials are based on the most recent Mortgage that was taken out on this home.
Original Mortgage
$264,797
Outstanding Balance
$202,451
Interest Rate
2.19%
Estimated Equity
$749,661
Purchase Details
Closed on
May 20, 2013
Sold by
Cox John R
Bought by
Cox John R
Home Financials for this Owner
Home Financials are based on the most recent Mortgage that was taken out on this home.
Original Mortgage
$330,500
Interest Rate
3.38%
Mortgage Type
New Conventional
Purchase Details
Closed on
Aug 9, 2005
Sold by
Cox John R
Bought by
Cox John R
Purchase Details
Closed on
Feb 1, 1999
Sold by
Leonard and Rita
Bought by
Cox John R
Home Financials for this Owner
Home Financials are based on the most recent Mortgage that was taken out on this home.
Original Mortgage
$197,344
Interest Rate
6.77%
Mortgage Type
FHA
Purchase Details
Closed on
Sep 16, 1985
Create a Home Valuation Report for This Property
The Home Valuation Report is an in-depth analysis detailing your home's value as well as a comparison with similar homes in the area
Home Values in the Area
Average Home Value in this Area
Purchase History
| Date | Buyer | Sale Price | Title Company |
|---|---|---|---|
| Cox John R | -- | Mortgage Connect | |
| Cox John Robert | -- | Mortgage Connect | |
| Cox John R | -- | Tsi | |
| Cox John R | -- | -- | |
| Cox John R | $215,500 | Fidelity National Title | |
| -- | $118,000 | -- |
Source: Public Records
Mortgage History
| Date | Status | Borrower | Loan Amount |
|---|---|---|---|
| Open | Cox John Robert | $264,797 | |
| Closed | Cox John R | $330,500 | |
| Closed | Cox John R | $197,344 |
Source: Public Records
Tax History Compared to Growth
Tax History
| Year | Tax Paid | Tax Assessment Tax Assessment Total Assessment is a certain percentage of the fair market value that is determined by local assessors to be the total taxable value of land and additions on the property. | Land | Improvement |
|---|---|---|---|---|
| 2025 | $3,690 | $337,813 | $98,690 | $239,123 |
| 2024 | $3,690 | $331,190 | $96,755 | $234,435 |
| 2023 | $3,622 | $324,697 | $94,858 | $229,839 |
| 2022 | $3,573 | $318,332 | $92,999 | $225,333 |
| 2021 | $3,436 | $312,091 | $91,176 | $220,915 |
| 2020 | $3,403 | $308,892 | $90,242 | $218,650 |
| 2019 | $3,363 | $302,836 | $88,473 | $214,363 |
| 2018 | $3,255 | $296,899 | $86,739 | $210,160 |
| 2017 | $133 | $291,079 | $85,039 | $206,040 |
| 2016 | $3,140 | $285,372 | $83,372 | $202,000 |
| 2015 | $3,093 | $281,086 | $82,120 | $198,966 |
| 2014 | $3,021 | $275,581 | $80,512 | $195,069 |
Source: Public Records
Map
Nearby Homes
- 639 Butterwood Ave
- 1524 Brook Rd
- 1477 Glen Avon Dr
- 1609 Desert Glen
- 1796 Lindsley Park Dr
- 1708 Woodbridge Rd
- 1401 W El Norte Pkwy Unit SPC 309
- 1401 W El Norte Pkwy Unit 145
- 1401 W El Norte Pkwy Unit SPC 25
- 1708 Harold Rd
- 0 Leaf Ln
- 1401 El Norte Pkwy Unit 34
- 1401 El Norte Pkwy Unit 60
- 1401 El Norte Pkwy Unit SPC 174
- 1401 El Norte Pkwy Unit 282
- 1401 El Norte Pkwy Unit SPC 326
- 1401 El Norte Pkwy Unit 145
- 1401 El Norte Pkwy Unit SPC 237
- 1233 Titan Ct
- 1715 Las Palmas Ln
- 1409 Rock Springs Rd
- 1415 Rock Springs Rd
- 1407 Rock Springs Rd
- 1417 Rock Springs Rd
- 605 Douglas Ave
- 1418 Oaks Ct
- 1405 Rock Springs Rd
- 1419 Rock Springs Rd Unit 4
- 704 Butterfield Ln
- 606 Douglas Ave
- 615 Douglas Ave
- 1414 Shadow Hills Dr
- 1403 Rock Springs Rd
- 1416 Shadow Hills Dr
- 1501 Rock Springs Rd
- 1412 Shadow Hills Dr Unit 4
- 1420 Oaks Ct
- 712 Butterfield Ln
- 1410 Shadow Hills Dr
- 616 Douglas Ave