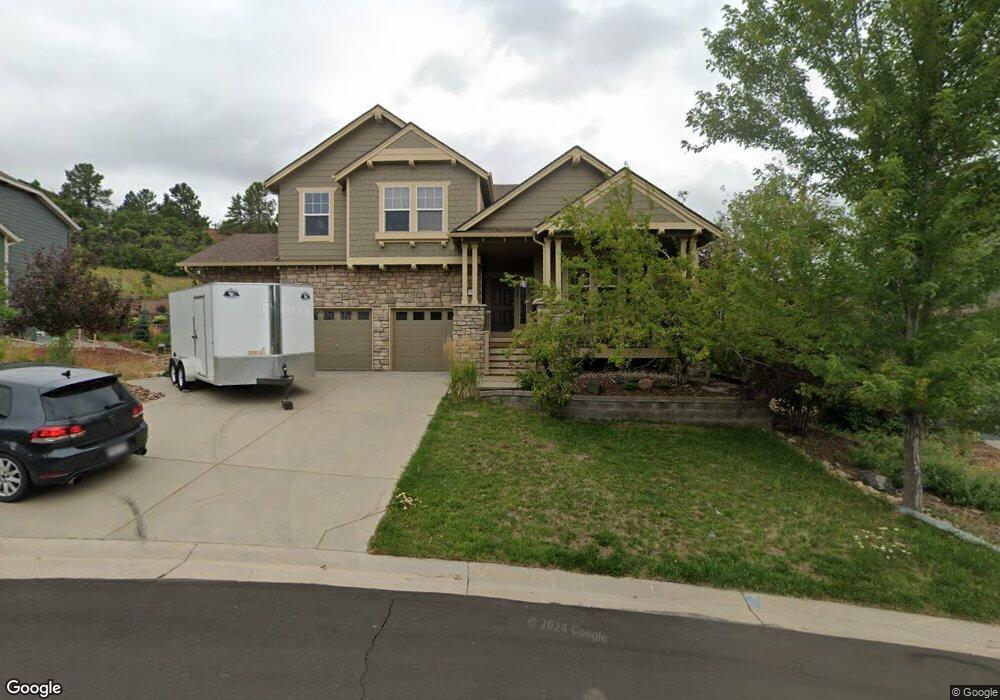
1413 Black Pine Ct Castle Rock, CO 80104
The Woodlands NeighborhoodEstimated Value: $799,000 - $906,000
4
Beds
3
Baths
2,793
Sq Ft
$304/Sq Ft
Est. Value
About This Home
This home is located at 1413 Black Pine Ct, Castle Rock, CO 80104 and is currently estimated at $849,644, approximately $304 per square foot. 1413 Black Pine Ct is a home located in Douglas County with nearby schools including Castle Rock Elementary School, Mesa Middle School, and Douglas County High School.
Ownership History
Date
Name
Owned For
Owner Type
Purchase Details
Closed on
Nov 12, 2019
Sold by
Underwood Darin W and Underwood Jil F
Bought by
Borski Petr
Current Estimated Value
Home Financials for this Owner
Home Financials are based on the most recent Mortgage that was taken out on this home.
Original Mortgage
$398,000
Outstanding Balance
$350,486
Interest Rate
3.65%
Mortgage Type
New Conventional
Estimated Equity
$499,158
Purchase Details
Closed on
Jun 27, 2003
Sold by
Engle Homes Colorado
Bought by
Underwood Darin W and Underwood Jil F
Home Financials for this Owner
Home Financials are based on the most recent Mortgage that was taken out on this home.
Original Mortgage
$302,000
Interest Rate
5.24%
Mortgage Type
Unknown
Purchase Details
Closed on
Jul 19, 2002
Sold by
Terrabrook Escavera Llc
Bought by
Engle Homes Colorado Inc
Purchase Details
Closed on
Sep 26, 2001
Sold by
Terrabrook Woodlands Llc
Bought by
Terrabrook Escavera Llc Fka Terrabrook W
Create a Home Valuation Report for This Property
The Home Valuation Report is an in-depth analysis detailing your home's value as well as a comparison with similar homes in the area
Home Values in the Area
Average Home Value in this Area
Purchase History
| Date | Buyer | Sale Price | Title Company |
|---|---|---|---|
| Borski Petr | $497,500 | First Integrity Title | |
| Underwood Darin W | $377,500 | Universal Land Title Co Inc | |
| Engle Homes Colorado Inc | $2,310,000 | -- | |
| Terrabrook Escavera Llc Fka Terrabrook W | -- | -- |
Source: Public Records
Mortgage History
| Date | Status | Borrower | Loan Amount |
|---|---|---|---|
| Open | Borski Petr | $398,000 | |
| Previous Owner | Underwood Darin W | $302,000 | |
| Closed | Underwood Darin W | $18,850 |
Source: Public Records
Tax History Compared to Growth
Tax History
| Year | Tax Paid | Tax Assessment Tax Assessment Total Assessment is a certain percentage of the fair market value that is determined by local assessors to be the total taxable value of land and additions on the property. | Land | Improvement |
|---|---|---|---|---|
| 2024 | $3,934 | $60,480 | $15,040 | $45,440 |
| 2023 | $3,989 | $60,480 | $15,040 | $45,440 |
| 2022 | $2,448 | $36,740 | $10,310 | $26,430 |
| 2021 | $2,555 | $36,740 | $10,310 | $26,430 |
| 2020 | $3,250 | $40,320 | $10,630 | $29,690 |
| 2019 | $3,393 | $40,320 | $10,630 | $29,690 |
| 2018 | $3,111 | $36,210 | $8,080 | $28,130 |
| 2017 | $2,896 | $36,210 | $8,080 | $28,130 |
| 2016 | $3,119 | $38,180 | $7,240 | $30,940 |
| 2015 | $3,191 | $38,180 | $7,240 | $30,940 |
| 2014 | $1,459 | $32,330 | $5,490 | $26,840 |
Source: Public Records
Map
Nearby Homes
- 2696 Castle Crest Dr
- 1044 N Bader Ct
- 2554 Saddleback Dr
- 2111 Ramblewood Ct
- 3469 Amber Sun Cir
- 3495 Amber Sun Cir
- 2596 Saddleback Dr
- 419 Johnson Dr
- 3455 Falling Star Place
- 3629 White Rose Loop
- 336 Dawson Dr
- 3708 White Rose Loop
- 2208 Paint Pony Cir
- 3584 Ghost Dance Dr
- 1767 Ghost Dance Cir
- 1387 Fox Canyon Ln
- 25 Oakridge Dr
- 3685 Sandy Vista Ln
- 1992 Woodbourne Terrace
- 2369 Bayberry Ln
- 1437 Black Pine Ct
- 1389 Black Pine Ct
- 1436 Black Pine Ct
- 1445 Black Pine Ct
- 1412 Black Pine Ct
- 1394 Black Pine Ct
- 1450 Black Pine Ct
- 1376 Sterling Hill Ct
- 1428 Sterling Hill Ct
- 1459 Black Pine Ct
- 1468 Black Pine Ct
- 1454 Sterling Hill Ct
- 1492 Black Pine Ct
- 1405 Sterling Hill Ct
- 1480 Sterling Hill Ct
- 1431 Sterling Hill Ct
- 2798 Hawk Point Ct
- 2801 Hawk Point Ct
- 1467 Sterling Hill Ct
- 2562 Crestridge Dr