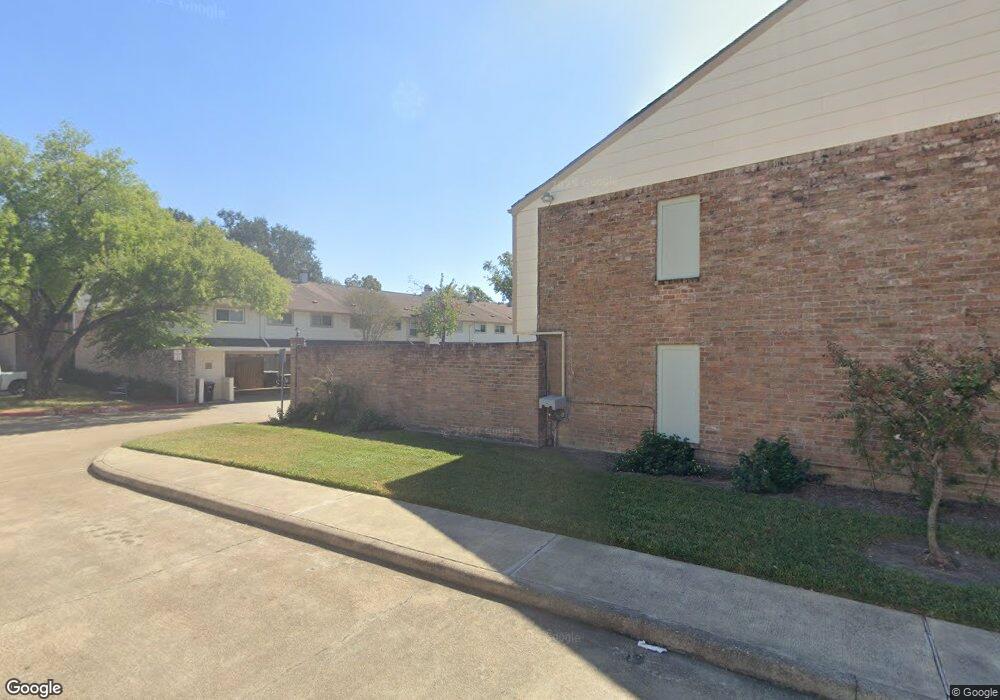
14144 Misty Meadow Ln Houston, TX 77079
Energy Corridor NeighborhoodEstimated Value: $304,000 - $316,000
4
Beds
3
Baths
2,632
Sq Ft
$117/Sq Ft
Est. Value
About This Home
This home is located at 14144 Misty Meadow Ln, Houston, TX 77079 and is currently estimated at $308,006, approximately $117 per square foot. 14144 Misty Meadow Ln is a home located in Harris County with nearby schools including Thornwood Elementary School, Spring Forest Middle School, and Stratford High School.
Ownership History
Date
Name
Owned For
Owner Type
Purchase Details
Closed on
Oct 3, 2022
Sold by
Johnson Paige
Bought by
Lilikas Athanasia
Current Estimated Value
Purchase Details
Closed on
Aug 16, 1996
Sold by
Scott Lillie Myers
Bought by
Schiltz Michael K and Starnes Mary A
Purchase Details
Closed on
Aug 7, 1996
Sold by
Needham Don W and Dickson Ruby Mae
Bought by
Schiltz Michael K and Starnes Mary A
Purchase Details
Closed on
Aug 1, 1996
Sold by
Gosnell Timothy G and Gosnell Sandy
Bought by
Schiltz Michael K and Starnes Mary A
Purchase Details
Closed on
Jul 22, 1996
Sold by
Sarff Jeffrey Lee and Karlskind Neil B
Bought by
Schiltz Michael K and Starnes Mary A
Purchase Details
Closed on
Jan 1, 1995
Sold by
Sproul Jeffrey D and Sproul Merle L
Bought by
Schiltz Michael K and Starnes Mary A
Purchase Details
Closed on
Feb 21, 1994
Sold by
Standish John K and Standish Bettina G
Bought by
Schiltz Michael K and Starnes Mary A
Create a Home Valuation Report for This Property
The Home Valuation Report is an in-depth analysis detailing your home's value as well as a comparison with similar homes in the area
Home Values in the Area
Average Home Value in this Area
Purchase History
| Date | Buyer | Sale Price | Title Company |
|---|---|---|---|
| Lilikas Athanasia | -- | Great American Title | |
| Schiltz Michael K | -- | -- | |
| Schiltz Michael K | -- | -- | |
| Schiltz Michael K | -- | -- | |
| Schiltz Michael K | -- | -- | |
| Schiltz Michael K | -- | American Title Company | |
| Schiltz Michael K | -- | American Title Company |
Source: Public Records
Tax History Compared to Growth
Tax History
| Year | Tax Paid | Tax Assessment Tax Assessment Total Assessment is a certain percentage of the fair market value that is determined by local assessors to be the total taxable value of land and additions on the property. | Land | Improvement |
|---|---|---|---|---|
| 2025 | $37 | $288,538 | $65,975 | $222,563 |
| 2024 | $37 | $285,630 | $65,975 | $219,655 |
| 2023 | $39 | $303,031 | $65,975 | $237,056 |
| 2022 | $5,414 | $232,576 | $65,975 | $166,601 |
| 2021 | $5,140 | $210,511 | $65,975 | $144,536 |
| 2020 | $5,247 | $209,421 | $65,975 | $143,446 |
| 2019 | $5,745 | $224,128 | $51,314 | $172,814 |
| 2018 | $0 | $199,489 | $51,314 | $148,175 |
| 2017 | $5,219 | $199,489 | $51,314 | $148,175 |
| 2016 | $4,837 | $215,903 | $36,653 | $179,250 |
| 2015 | $3,044 | $215,903 | $36,653 | $179,250 |
| 2014 | $3,044 | $179,130 | $29,322 | $149,808 |
Source: Public Records
Map
Nearby Homes
- 14143 Lost Meadow Ln
- 14226 Misty Meadow Ln
- 14228 Misty Meadow Ln
- 14151 Lost Meadow Ln
- 14123 Misty Meadow Ln
- 14171 Misty Meadow Ln
- 14213 Lost Meadow Ln
- 14325 Lost Meadow Ln
- 14122 Barryknoll Ln
- 14311 Misty Meadow Ln
- 14322 Misty Meadow Ln
- 1334 Country Place Dr
- 14387 Misty Meadow Ln
- 1310 Country Place Dr
- 14407 Still Meadow Dr
- 1381 Country Place Dr Unit 23
- 13931 Kingsride Ln
- 14135 Kimberley Ln
- 1071 Country Place Dr Unit 1071
- 1147 Country Place Dr
- 14146 Misty Meadow Ln
- 14142 Misty Meadow Ln
- 14148 Misty Meadow Ln
- 14148 Misty
- 14140 Misty Meadow Ln
- 14150 Misty Meadow Ln
- 14138 Misty Meadow Ln
- 14122 Misty Meadow Ln
- 14136 Misty Meadow Ln
- 14124 Misty Meadow Ln
- 14118 Misty Meadow Ln
- 14126 Misty Meadow Ln
- 14134 Misty Meadow Ln
- 14116 Misty Meadow Ln
- 14174 Misty Meadow Ln
- 14176 Misty Meadow Ln
- 14172 Misty Meadow Ln
- 14178 Misty Meadow Ln
- 14128 Misty Meadow Ln
- 14170 Misty Meadow Ln