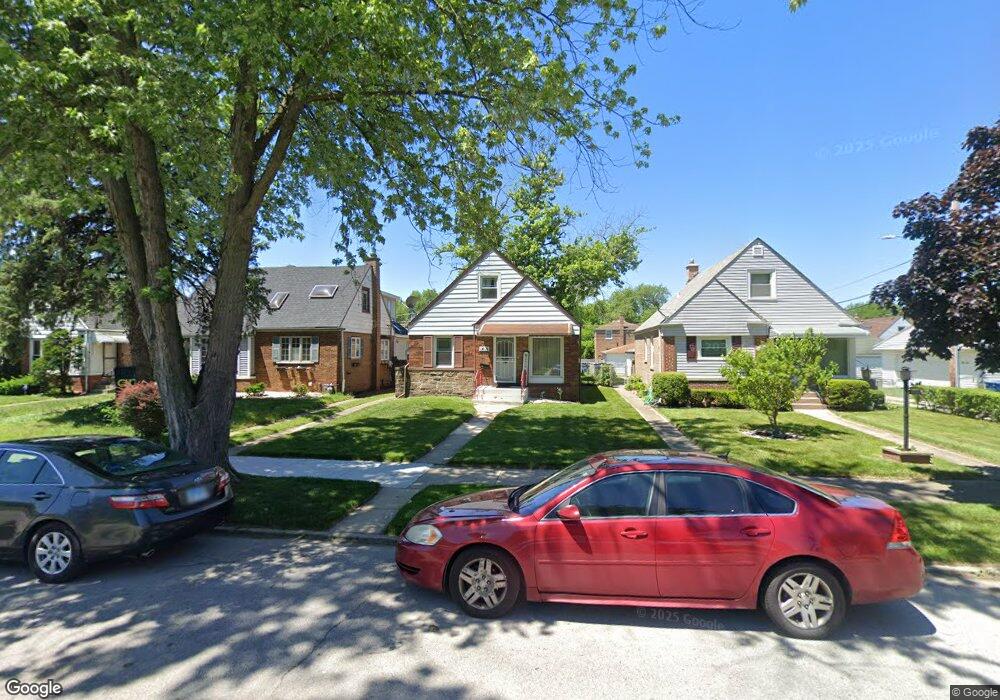
1416 Shirley Dr Calumet City, IL 60409
Estimated Value: $131,000 - $183,000
3
Beds
2
Baths
750
Sq Ft
$206/Sq Ft
Est. Value
About This Home
This home is located at 1416 Shirley Dr, Calumet City, IL 60409 and is currently estimated at $154,319, approximately $205 per square foot. 1416 Shirley Dr is a home located in Cook County with nearby schools including Hoover Elementary School, Schrum Memorial Middle School, and Thornton Fractional North High School.
Ownership History
Date
Name
Owned For
Owner Type
Purchase Details
Closed on
Mar 29, 2017
Sold by
The Bank Of New York Mellon
Bought by
A Plus Development Corporation
Current Estimated Value
Purchase Details
Closed on
Nov 23, 2016
Sold by
Winston Ronald
Bought by
The Bank Of New York Mellon and Jpmorgan Chase Bank Na
Purchase Details
Closed on
Jul 23, 1999
Sold by
Burkhart William J and Burkhart Trina M
Bought by
Winston Ronald and Anderson Marion
Home Financials for this Owner
Home Financials are based on the most recent Mortgage that was taken out on this home.
Original Mortgage
$71,920
Interest Rate
7.68%
Mortgage Type
Balloon
Purchase Details
Closed on
Apr 27, 1995
Sold by
Hartog Russell C and Hartog Linda J
Bought by
Burkhart William J and Burkhart Trina M
Home Financials for this Owner
Home Financials are based on the most recent Mortgage that was taken out on this home.
Original Mortgage
$78,750
Interest Rate
8.4%
Create a Home Valuation Report for This Property
The Home Valuation Report is an in-depth analysis detailing your home's value as well as a comparison with similar homes in the area
Home Values in the Area
Average Home Value in this Area
Purchase History
| Date | Buyer | Sale Price | Title Company |
|---|---|---|---|
| A Plus Development Corporation | $15,640 | None Available | |
| The Bank Of New York Mellon | -- | Attorney | |
| Winston Ronald | $89,000 | -- | |
| Burkhart William J | $83,000 | Attorneys Natl Title Network |
Source: Public Records
Mortgage History
| Date | Status | Borrower | Loan Amount |
|---|---|---|---|
| Previous Owner | Winston Ronald | $71,920 | |
| Previous Owner | Burkhart William J | $78,750 | |
| Closed | Winston Ronald | $17,980 |
Source: Public Records
Tax History Compared to Growth
Tax History
| Year | Tax Paid | Tax Assessment Tax Assessment Total Assessment is a certain percentage of the fair market value that is determined by local assessors to be the total taxable value of land and additions on the property. | Land | Improvement |
|---|---|---|---|---|
| 2024 | $6,576 | $10,000 | $2,040 | $7,960 |
| 2023 | $5,486 | $10,000 | $2,040 | $7,960 |
| 2022 | $5,486 | $6,434 | $1,800 | $4,634 |
| 2021 | $5,383 | $6,434 | $1,800 | $4,634 |
| 2020 | $4,547 | $6,434 | $1,800 | $4,634 |
| 2019 | $4,708 | $6,332 | $1,680 | $4,652 |
| 2018 | $4,737 | $6,332 | $1,680 | $4,652 |
| 2017 | $2,101 | $6,332 | $1,680 | $4,652 |
| 2016 | $2,512 | $6,224 | $1,560 | $4,664 |
| 2015 | $2,391 | $6,224 | $1,560 | $4,664 |
| 2014 | $2,334 | $6,224 | $1,560 | $4,664 |
| 2013 | $2,543 | $6,935 | $1,560 | $5,375 |
Source: Public Records
Map
Nearby Homes
- 107 163rd St
- 43 163rd St
- 1464 Shirley Dr
- 1374 Kenilworth Dr
- 1420 Wentworth Ave
- 1404 Wentworth Ave Unit 1
- 16 164th Place
- 1461 Wentworth Ave
- 1473 Wentworth Ave
- 1480 State Line Rd
- 1375 Forest Place
- 1481 Lincoln Ave
- 1514 State Line Rd
- 1527 Wentworth Ave
- 1373 Stanley Blvd
- 1490 Lincoln Ave
- 1481 Lincoln Place
- 1522 Forest Ave
- 1395 Freeland Ave
- 34 Midway Ct
- 1412 Shirley Dr
- 1420 Shirley Dr
- 1422 Shirley Dr
- 1424 Shirley Dr
- 101 163rd St
- 1415 Kenilworth Dr
- 111 163rd St
- 46 163rd Place
- 1413 Kenilworth Dr
- 1417 Kenilworth Dr
- 1426 Shirley Dr
- 1421 Kenilworth Dr
- 113 163rd St
- 113 163rd St
- 42 163rd Place
- 1425 Kenilworth Dr
- 1428 Shirley Dr
- 117 163rd St
- 1427 Kenilworth Dr
- 121 163rd St