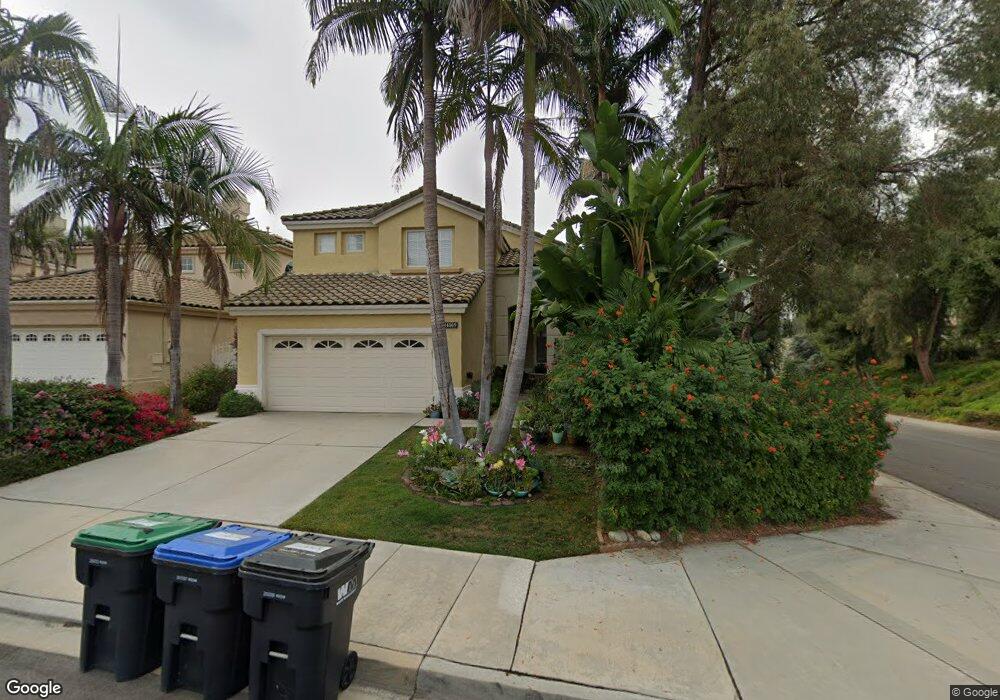
14169 Applegate Ln Chino Hills, CA 91709
North Chino Hills NeighborhoodEstimated Value: $1,121,627 - $1,209,000
3
Beds
3
Baths
2,075
Sq Ft
$564/Sq Ft
Est. Value
About This Home
This home is located at 14169 Applegate Ln, Chino Hills, CA 91709 and is currently estimated at $1,171,157, approximately $564 per square foot. 14169 Applegate Ln is a home located in San Bernardino County with nearby schools including Country Springs Elementary School, Canyon Hills Junior High School, and Ruben S. Ayala High School.
Ownership History
Date
Name
Owned For
Owner Type
Purchase Details
Closed on
Jun 7, 2010
Sold by
Sarmiento Danilo Papa
Bought by
Sarmiento Danilo P and Sarmiento Myrna P
Current Estimated Value
Purchase Details
Closed on
Dec 3, 1999
Sold by
Castro Miguel A
Bought by
Sarmiento Danilo Papa and Sarmiento Myrna Pacifico
Home Financials for this Owner
Home Financials are based on the most recent Mortgage that was taken out on this home.
Original Mortgage
$204,000
Outstanding Balance
$63,043
Interest Rate
7.69%
Estimated Equity
$1,108,114
Purchase Details
Closed on
Jul 29, 1994
Sold by
Udc Homes Inc
Bought by
Castro Miguel A and Castro Annie
Home Financials for this Owner
Home Financials are based on the most recent Mortgage that was taken out on this home.
Original Mortgage
$185,000
Interest Rate
9.09%
Create a Home Valuation Report for This Property
The Home Valuation Report is an in-depth analysis detailing your home's value as well as a comparison with similar homes in the area
Home Values in the Area
Average Home Value in this Area
Purchase History
| Date | Buyer | Sale Price | Title Company |
|---|---|---|---|
| Sarmiento Danilo P | -- | None Available | |
| Sarmiento Danilo Papa | $255,000 | Chicago Title Co | |
| Castro Miguel A | $247,000 | First American Title Ins Co |
Source: Public Records
Mortgage History
| Date | Status | Borrower | Loan Amount |
|---|---|---|---|
| Open | Sarmiento Danilo Papa | $204,000 | |
| Previous Owner | Castro Miguel A | $185,000 | |
| Closed | Castro Miguel A | $36,500 |
Source: Public Records
Tax History Compared to Growth
Tax History
| Year | Tax Paid | Tax Assessment Tax Assessment Total Assessment is a certain percentage of the fair market value that is determined by local assessors to be the total taxable value of land and additions on the property. | Land | Improvement |
|---|---|---|---|---|
| 2025 | $4,685 | $391,932 | $137,178 | $254,754 |
| 2024 | $4,685 | $384,247 | $134,488 | $249,759 |
| 2023 | $4,568 | $376,713 | $131,851 | $244,862 |
| 2022 | $4,543 | $369,327 | $129,266 | $240,061 |
| 2021 | $4,462 | $362,085 | $126,731 | $235,354 |
| 2020 | $4,410 | $358,373 | $125,432 | $232,941 |
| 2019 | $4,952 | $351,347 | $122,973 | $228,374 |
| 2018 | $4,854 | $344,458 | $120,562 | $223,896 |
| 2017 | $4,774 | $337,704 | $118,198 | $219,506 |
| 2016 | $4,520 | $331,082 | $115,880 | $215,202 |
| 2015 | $4,439 | $326,108 | $114,139 | $211,969 |
| 2014 | $4,359 | $319,720 | $111,903 | $207,817 |
Source: Public Records
Map
Nearby Homes
- 14155 Applegate Ln
- 13698 Monteverde Dr
- 14269 Sapphire Hill Ln
- 2417 Brookhaven Dr
- 2286 Black Pine Rd
- 2460 Windmill Creek Rd
- 13593 Monte Royale Dr
- 13577 Monte Royale Dr
- 2210 Olympic View Dr
- 2638 Highridge Dr
- 13470 Palamos Place
- 14726 Moon Crest Ln Unit E
- 14748 Moon Crest Ln Unit E
- 2432 Moon Dust Dr Unit B
- 2516 Sundial Dr Unit B
- 13952 Woodrose Ct
- 2308 Wandering Ridge Dr
- 1525 Rancho Hills Dr
- 2694 Olympic View Dr
- 2155 Camino Largo Dr
- 14163 Applegate Ln
- 14155 Applegate Ln
- 14147 Applegate Ln
- 14164 Applegate Ln
- 14156 Applegate Ln
- 14139 Applegate Ln
- 14169 Wildrose Ln
- 1884 Foxgate Ln
- 1892 Foxgate Ln
- 14148 Applegate Ln
- 14126 Deerbrook Ln
- 14138 Deerbrook Ln
- 14144 Deerbrook Ln
- 14132 Deerbrook Ln
- 14164 Wildrose Ln
- 1876 Foxgate Ln
- 14120 Deerbrook Ln
- 14150 Deerbrook Ln
- 14156 Deerbrook Ln
- 14131 Applegate Ln