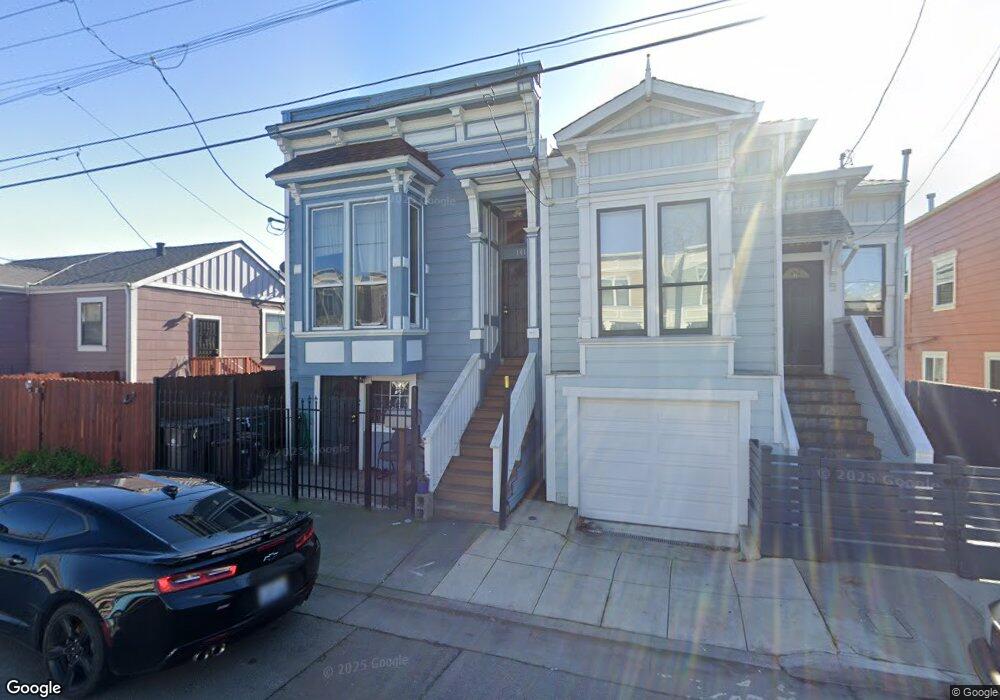
1417 11th St Oakland, CA 94607
West Oakland NeighborhoodEstimated Value: $395,000 - $489,168
2
Beds
1
Bath
916
Sq Ft
$495/Sq Ft
Est. Value
About This Home
This home is located at 1417 11th St, Oakland, CA 94607 and is currently estimated at $453,292, approximately $494 per square foot. 1417 11th St is a home located in Alameda County with nearby schools including Prescott Elementary School, West Oakland Middle School, and McClymonds High School.
Ownership History
Date
Name
Owned For
Owner Type
Purchase Details
Closed on
Aug 8, 2013
Sold by
Hernandez Fabiola
Bought by
Hernandez Rafael
Current Estimated Value
Home Financials for this Owner
Home Financials are based on the most recent Mortgage that was taken out on this home.
Original Mortgage
$159,480
Outstanding Balance
$118,315
Interest Rate
4.33%
Mortgage Type
New Conventional
Estimated Equity
$334,977
Purchase Details
Closed on
Feb 25, 2003
Sold by
Hernandez Rafael and Sanchez Maria
Bought by
Hernandez Rafael
Purchase Details
Closed on
Jun 24, 1998
Sold by
Cohen Margaret M and Rios Carmen
Bought by
Hernandez Gabriel and Kubein Roger S
Purchase Details
Closed on
May 28, 1998
Sold by
Martin Paula R
Bought by
Hernandez Gabriel and Kubein Roger S
Purchase Details
Closed on
Apr 2, 1997
Sold by
Baugh Edna J and Riley Dorothyjackson
Bought by
Hernandez Rafael and Sanchez Maria
Create a Home Valuation Report for This Property
The Home Valuation Report is an in-depth analysis detailing your home's value as well as a comparison with similar homes in the area
Home Values in the Area
Average Home Value in this Area
Purchase History
| Date | Buyer | Sale Price | Title Company |
|---|---|---|---|
| Hernandez Rafael | -- | First American Title Ins Co | |
| Hernandez Rafael | -- | -- | |
| Hernandez Gabriel | $42,500 | North American Title Co | |
| Hernandez Gabriel | $50,000 | North American Title Co | |
| Hernandez Rafael | $18,000 | First American Title Guarant |
Source: Public Records
Mortgage History
| Date | Status | Borrower | Loan Amount |
|---|---|---|---|
| Open | Hernandez Rafael | $159,480 |
Source: Public Records
Tax History Compared to Growth
Tax History
| Year | Tax Paid | Tax Assessment Tax Assessment Total Assessment is a certain percentage of the fair market value that is determined by local assessors to be the total taxable value of land and additions on the property. | Land | Improvement |
|---|---|---|---|---|
| 2025 | $2,211 | $29,314 | $8,794 | $20,520 |
| 2024 | $2,211 | $28,738 | $8,621 | $20,117 |
| 2023 | $2,184 | $28,175 | $8,452 | $19,723 |
| 2022 | $2,048 | $27,623 | $8,287 | $19,336 |
| 2021 | $1,788 | $27,081 | $8,124 | $18,957 |
| 2020 | $1,766 | $26,804 | $8,041 | $18,763 |
| 2019 | $1,593 | $26,278 | $7,883 | $18,395 |
| 2018 | $1,564 | $25,764 | $7,729 | $18,035 |
| 2017 | $1,465 | $25,258 | $7,577 | $17,681 |
| 2016 | $1,315 | $24,763 | $7,429 | $17,334 |
| 2015 | $1,303 | $24,391 | $7,317 | $17,074 |
| 2014 | $1,189 | $23,914 | $7,174 | $16,740 |
Source: Public Records
Map
Nearby Homes