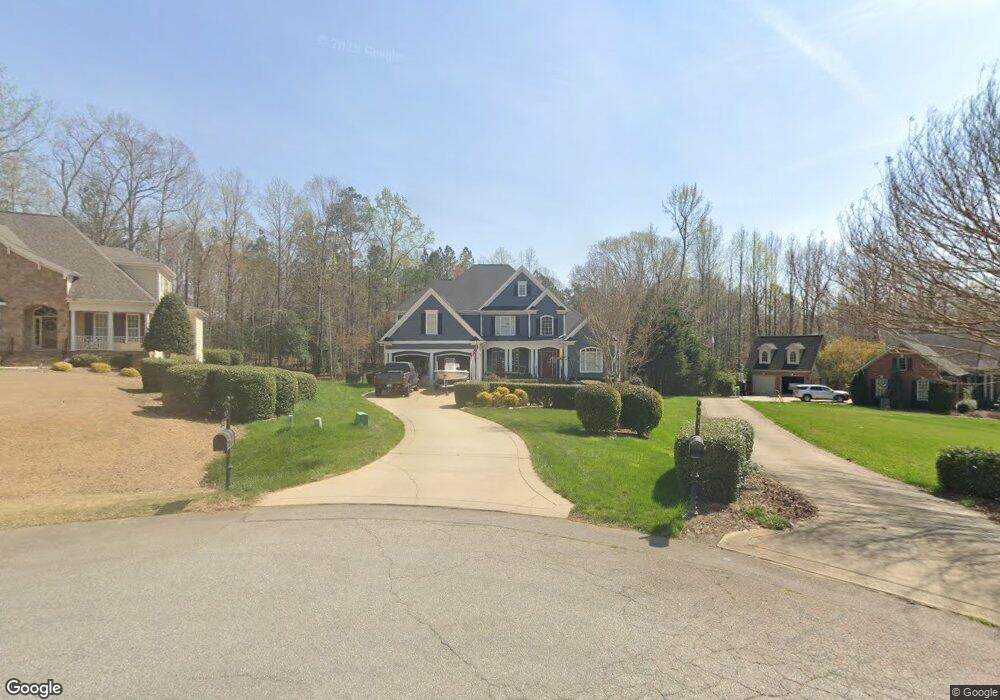
1417 Wynncrest Ct Raleigh, NC 27603
Estimated Value: $875,000 - $965,513
3
Beds
4
Baths
4,175
Sq Ft
$223/Sq Ft
Est. Value
About This Home
This home is located at 1417 Wynncrest Ct, Raleigh, NC 27603 and is currently estimated at $929,628, approximately $222 per square foot. 1417 Wynncrest Ct is a home located in Wake County with nearby schools including Banks Road Elementary School.
Ownership History
Date
Name
Owned For
Owner Type
Purchase Details
Closed on
Jan 24, 2022
Sold by
Johnson Denise M
Bought by
Johnson Ryan E
Current Estimated Value
Purchase Details
Closed on
Nov 14, 2017
Sold by
Scott Stephen C and Scott Patsy J
Bought by
Johnson Ryan E and Johnson Denise M
Home Financials for this Owner
Home Financials are based on the most recent Mortgage that was taken out on this home.
Original Mortgage
$395,200
Interest Rate
3.85%
Mortgage Type
New Conventional
Purchase Details
Closed on
Dec 19, 2003
Sold by
Tripp Loyd Builders Llc
Bought by
Scott Stephen C and Scott Patsy J
Home Financials for this Owner
Home Financials are based on the most recent Mortgage that was taken out on this home.
Original Mortgage
$428,000
Interest Rate
5.97%
Mortgage Type
Purchase Money Mortgage
Purchase Details
Closed on
Nov 28, 2001
Sold by
J T Matthews Inc
Bought by
Djf Builders Inc
Create a Home Valuation Report for This Property
The Home Valuation Report is an in-depth analysis detailing your home's value as well as a comparison with similar homes in the area
Home Values in the Area
Average Home Value in this Area
Purchase History
| Date | Buyer | Sale Price | Title Company |
|---|---|---|---|
| Johnson Ryan E | -- | None Listed On Document | |
| Johnson Ryan E | $494,000 | None Available | |
| Scott Stephen C | $535,000 | -- | |
| Tripp Loyd Builders Llc | -- | -- | |
| Djf Builders Inc | $420,000 | -- |
Source: Public Records
Mortgage History
| Date | Status | Borrower | Loan Amount |
|---|---|---|---|
| Previous Owner | Johnson Ryan E | $395,200 | |
| Previous Owner | Tripp Loyd Builders Llc | $428,000 | |
| Closed | Tripp Loyd Builders Llc | $53,500 |
Source: Public Records
Tax History Compared to Growth
Tax History
| Year | Tax Paid | Tax Assessment Tax Assessment Total Assessment is a certain percentage of the fair market value that is determined by local assessors to be the total taxable value of land and additions on the property. | Land | Improvement |
|---|---|---|---|---|
| 2025 | $4,993 | $777,564 | $100,000 | $677,564 |
| 2024 | $4,849 | $777,564 | $100,000 | $677,564 |
| 2023 | $3,958 | $505,014 | $65,000 | $440,014 |
| 2022 | $3,667 | $505,014 | $65,000 | $440,014 |
| 2021 | $3,609 | $505,014 | $65,000 | $440,014 |
| 2020 | $3,390 | $487,696 | $65,000 | $422,696 |
| 2019 | $3,991 | $486,216 | $60,000 | $426,216 |
| 2018 | $3,669 | $486,216 | $60,000 | $426,216 |
| 2017 | $3,477 | $486,216 | $60,000 | $426,216 |
| 2016 | $3,407 | $486,216 | $60,000 | $426,216 |
| 2015 | $3,866 | $553,785 | $70,000 | $483,785 |
| 2014 | $3,664 | $553,785 | $70,000 | $483,785 |
Source: Public Records
Map
Nearby Homes
- 4824 Bristol Meadow Dr
- 5060 Trotter Dr
- 1329 Wynncrest Ct
- 5057 Trotter Dr
- 5040 Trotter Dr
- 4705 Trotter Dr
- The Crawford Plan at Laneridge Estates
- The Crawford C Plan at Laneridge Estates
- The Beech Plan at Laneridge Estates
- 4620 Cresta Dr
- 51 Cheshire Downs Ct
- 2600 Banks Rd Unit Lot 2
- 2600 Banks Rd Unit Lot 1
- 9812 Chris Dr
- 9600 Chris Dr
- 3112 Constance Cir
- 2704 Stageline Dr
- 5216 Relay Way
- 10329 Fanny Brown Rd
- 3205 Banks Rd
- 1413 Wynncrest Ct
- 1420 Wynncrest Ct
- 1409 Wynncrest Ct
- 1416 Wynncrest Ct
- 1408 Wynncrest Ct
- 4800 Bristol Meadow Dr
- 1400 Wynncrest Ct
- 1328 Wynncrest Ct
- 9424 Old Stage Rd
- 1325 Wynncrest Ct
- 1324 Wynncrest Ct
- 1321 Wynncrest Ct
- 2908 BetiMcA Dr
- 2912 BetiMcA Dr
- 1320 Wynncrest Ct
- 9813 Fanny Brown Rd
- 2906 BetiMcA Dr
- 2910 BetiMcA Dr
- 1317 Wynncrest Ct
- 1316 Wynncrest Ct