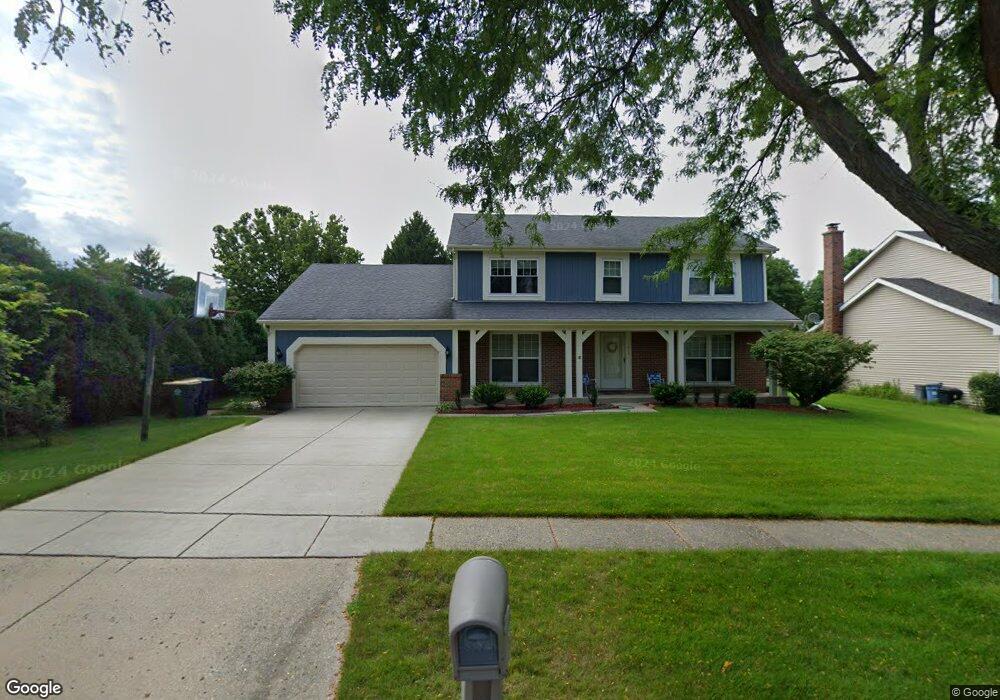
1419 Forever Ave Libertyville, IL 60048
Interlaken NeighborhoodEstimated Value: $715,502 - $769,000
5
Beds
3
Baths
2,571
Sq Ft
$293/Sq Ft
Est. Value
About This Home
This home is located at 1419 Forever Ave, Libertyville, IL 60048 and is currently estimated at $753,126, approximately $292 per square foot. 1419 Forever Ave is a home located in Lake County with nearby schools including Butterfield School, Highland Middle School, and Libertyville High School.
Ownership History
Date
Name
Owned For
Owner Type
Purchase Details
Closed on
Oct 18, 2010
Sold by
Yan Qing and Huang Ping
Bought by
Yan Qing and Huang Ping
Current Estimated Value
Purchase Details
Closed on
Aug 9, 2006
Sold by
Formento Michael A and Formento Karina K
Bought by
Yan Qing and Huang Ping
Home Financials for this Owner
Home Financials are based on the most recent Mortgage that was taken out on this home.
Original Mortgage
$200,000
Outstanding Balance
$110,768
Interest Rate
5.37%
Mortgage Type
Purchase Money Mortgage
Estimated Equity
$642,358
Purchase Details
Closed on
Apr 14, 2006
Sold by
Hanlon Edmund C and Hanlon Andra M
Bought by
Formento Michael A and Formento Karina K
Home Financials for this Owner
Home Financials are based on the most recent Mortgage that was taken out on this home.
Original Mortgage
$404,000
Interest Rate
6%
Mortgage Type
Fannie Mae Freddie Mac
Create a Home Valuation Report for This Property
The Home Valuation Report is an in-depth analysis detailing your home's value as well as a comparison with similar homes in the area
Home Values in the Area
Average Home Value in this Area
Purchase History
| Date | Buyer | Sale Price | Title Company |
|---|---|---|---|
| Yan Qing | -- | None Available | |
| Yan Qing | $600,000 | Fort Dearborn Land Title | |
| Formento Michael A | $505,000 | Chicago Title Insurance Co |
Source: Public Records
Mortgage History
| Date | Status | Borrower | Loan Amount |
|---|---|---|---|
| Open | Yan Qing | $200,000 | |
| Previous Owner | Formento Michael A | $404,000 |
Source: Public Records
Tax History Compared to Growth
Tax History
| Year | Tax Paid | Tax Assessment Tax Assessment Total Assessment is a certain percentage of the fair market value that is determined by local assessors to be the total taxable value of land and additions on the property. | Land | Improvement |
|---|---|---|---|---|
| 2024 | $15,131 | $212,377 | $61,520 | $150,857 |
| 2023 | $13,377 | $195,883 | $56,742 | $139,141 |
| 2022 | $13,377 | $173,258 | $54,538 | $118,720 |
| 2021 | $12,879 | $169,528 | $53,364 | $116,164 |
| 2020 | $13,216 | $177,317 | $55,816 | $121,501 |
| 2019 | $12,887 | $175,631 | $55,285 | $120,346 |
| 2018 | $12,433 | $172,943 | $55,356 | $117,587 |
| 2017 | $12,093 | $167,483 | $53,608 | $113,875 |
| 2016 | $12,588 | $170,482 | $50,828 | $119,654 |
| 2015 | $12,478 | $159,344 | $47,507 | $111,837 |
| 2014 | $12,095 | $151,598 | $45,505 | $106,093 |
| 2012 | $11,494 | $152,912 | $45,900 | $107,012 |
Source: Public Records
Map
Nearby Homes
- 1708 Park Crest Ct
- 1917 Halifax St
- 1338 Trinity Place
- 1801 Torrey Pkwy
- 1506 Bull Creek Dr
- 1960 Pinehurst Ct
- 1834 Torrey Pkwy Unit 103
- 1512 Sunnyview Rd
- 832 Interlaken Ln
- 178 Brookhill Rd
- 531 Salceda Ln
- 591 Salceda Ln
- 200 Ambria Dr
- 1291 Banbury Rd
- 1935 Lynn Cir
- 1304 Dunleer Dr
- 223 Kenloch Ave
- 694 Parkside Ct
- 662 Parkside Ct
- 1216 Kensington Dr
- 1423 Forever Ave
- 1724 Virginia Ave
- 1728 Virginia Ave
- 1503 Forever Ave
- 1801 Josilyn Ct
- 1418 Forever Ave
- 1805 Josilyn Ct
- 1732 Virginia Ave
- 1422 Forever Ave
- 1720 Virginia Ave
- 1507 Forever Ave
- 1502 Forever Ave
- 1736 Virginia Ave
- 1800 Josilyn Ct
- 1331 Forever Ave
- 1713 Park Crest Ct
- 1716 Virginia Ave
- 1729 Virginia Ave
- 1511 Forever Ave
- 1332 Forever Ave