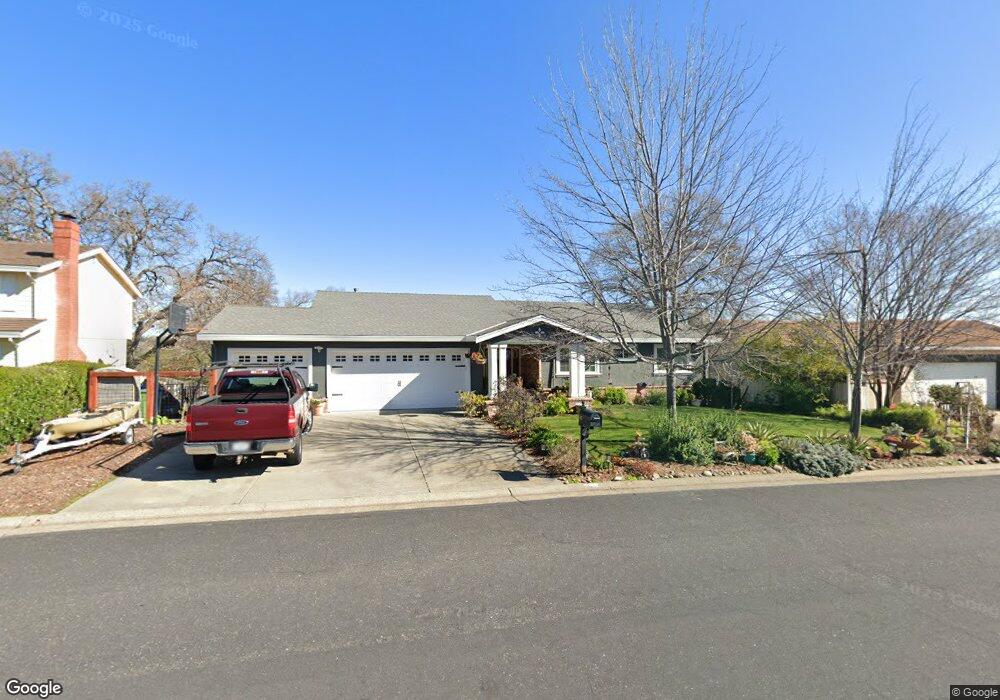
142 Canyon Rim Dr Folsom, CA 95630
American River Canyon NeighborhoodEstimated Value: $712,000 - $1,058,000
4
Beds
3
Baths
3,277
Sq Ft
$279/Sq Ft
Est. Value
About This Home
This home is located at 142 Canyon Rim Dr, Folsom, CA 95630 and is currently estimated at $914,176, approximately $278 per square foot. 142 Canyon Rim Dr is a home located in Sacramento County with nearby schools including Carl H. Sundahl Elementary School, Sutter Middle School, and Folsom High School.
Ownership History
Date
Name
Owned For
Owner Type
Purchase Details
Closed on
Jan 2, 2020
Sold by
Guzman Carol M
Bought by
Guzman Carol and Carol Guzman Revocable Living
Current Estimated Value
Purchase Details
Closed on
Nov 15, 2012
Sold by
Guzman Rudolph J
Bought by
Guzman Carol M
Home Financials for this Owner
Home Financials are based on the most recent Mortgage that was taken out on this home.
Original Mortgage
$328,000
Outstanding Balance
$226,225
Interest Rate
3.35%
Mortgage Type
New Conventional
Estimated Equity
$687,951
Purchase Details
Closed on
Feb 22, 2001
Sold by
Gallegos Audoro O and Gallegos Anita M
Bought by
Guzman Rudolph J and Guzman Carol M
Home Financials for this Owner
Home Financials are based on the most recent Mortgage that was taken out on this home.
Original Mortgage
$274,800
Interest Rate
6.98%
Create a Home Valuation Report for This Property
The Home Valuation Report is an in-depth analysis detailing your home's value as well as a comparison with similar homes in the area
Home Values in the Area
Average Home Value in this Area
Purchase History
| Date | Buyer | Sale Price | Title Company |
|---|---|---|---|
| Guzman Carol | -- | None Available | |
| Guzman Carol M | -- | Fidelity National Title Comp | |
| Guzman Rudolph J | $343,500 | Fidelity National Title Co |
Source: Public Records
Mortgage History
| Date | Status | Borrower | Loan Amount |
|---|---|---|---|
| Open | Guzman Carol M | $328,000 | |
| Closed | Guzman Rudolph J | $274,800 |
Source: Public Records
Tax History Compared to Growth
Tax History
| Year | Tax Paid | Tax Assessment Tax Assessment Total Assessment is a certain percentage of the fair market value that is determined by local assessors to be the total taxable value of land and additions on the property. | Land | Improvement |
|---|---|---|---|---|
| 2025 | $5,937 | $562,881 | $144,645 | $418,236 |
| 2024 | $5,937 | $551,845 | $141,809 | $410,036 |
| 2023 | $5,830 | $541,026 | $139,029 | $401,997 |
| 2022 | $5,743 | $530,418 | $136,303 | $394,115 |
| 2021 | $5,666 | $520,019 | $133,631 | $386,388 |
| 2020 | $5,595 | $514,688 | $132,261 | $382,427 |
| 2019 | $5,578 | $504,597 | $129,668 | $374,929 |
| 2018 | $5,439 | $494,704 | $127,126 | $367,578 |
| 2017 | $5,073 | $485,005 | $124,634 | $360,371 |
| 2016 | $5,300 | $475,496 | $122,191 | $353,305 |
| 2015 | $5,122 | $468,355 | $120,356 | $347,999 |
| 2014 | $4,862 | $459,182 | $117,999 | $341,183 |
Source: Public Records
Map
Nearby Homes
- 103 S Fork Way
- 134 Gold Creek Cir
- 106 Oak Rim Way
- 224 Oak Canyon Way
- 203 Crow Canyon Dr
- 621 Landrise Ct
- 7230 Pine Grove Way
- 600 Landrise Ct
- 7314 Santa Juanita Ave
- 413 Marsalla Dr
- 116 Pheasant Ln
- 115 American River Canyon Dr
- 303 Marsalla Dr
- 119 Del Norte Vista Way
- 105 Eagle Creek Ct
- 147 American River Canyon Dr
- 0 Folsom-Auburn Rd
- 73 Redwood Ln
- 46 Cedar Cir
- 100 Englehart Dr
- 144 Canyon Rim Dr
- 140 Canyon Rim Dr
- 138 Canyon Rim Dr
- 141 Canyon Rim Dr
- 146 Canyon Rim Dr
- 139 Canyon Rim Dr
- 137 Canyon Rim Dr
- 136 Canyon Rim Dr
- 148 Canyon Rim Dr
- 120 Blue Canyon Way
- 116 Rock Canyon Ct
- 124 Rock Canyon Ct
- 147 Canyon Rim Dr
- 135 Canyon Rim Dr
- 118 Blue Canyon Way
- 134 Canyon Rim Dr
- 150 Canyon Rim Dr
- 116 Blue Canyon Way
- 101 Gold Mine Ct
- 133 Canyon Rim Dr