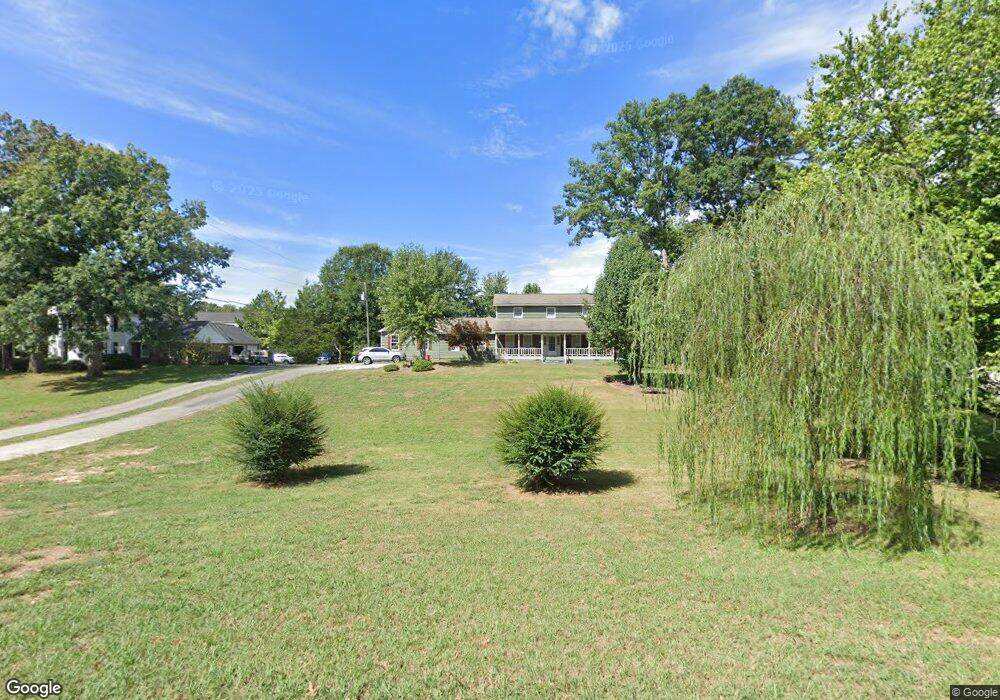
1421 Thrasher Hills Dr NE Dalton, GA 30721
Estimated Value: $283,000 - $485,000
3
Beds
2
Baths
3,144
Sq Ft
$128/Sq Ft
Est. Value
About This Home
This home is located at 1421 Thrasher Hills Dr NE, Dalton, GA 30721 and is currently estimated at $401,721, approximately $127 per square foot. 1421 Thrasher Hills Dr NE is a home located in Whitfield County with nearby schools including Dawnville Elementary School, Coahulla Creek High School, and Cedar Valley Christian Academy.
Ownership History
Date
Name
Owned For
Owner Type
Purchase Details
Closed on
Dec 14, 2017
Sold by
Ineson Peter M
Bought by
Ineson Dianna K
Current Estimated Value
Purchase Details
Closed on
Apr 24, 2015
Sold by
Mcm Capital Partners Llc T
Bought by
Ineson Peter M and Ineson Dianna K
Home Financials for this Owner
Home Financials are based on the most recent Mortgage that was taken out on this home.
Original Mortgage
$123,000
Interest Rate
3.79%
Mortgage Type
New Conventional
Purchase Details
Closed on
Sep 2, 2014
Sold by
Bsi Financial Svcs
Bought by
Bsi Financial Svcs Inc
Purchase Details
Closed on
Jul 6, 2000
Sold by
Duggan John A and Duggan Robin S
Bought by
Palmer Stephen Russell
Purchase Details
Closed on
Jul 1, 1996
Bought by
Duggan John A and Duggan Robin S
Create a Home Valuation Report for This Property
The Home Valuation Report is an in-depth analysis detailing your home's value as well as a comparison with similar homes in the area
Home Values in the Area
Average Home Value in this Area
Purchase History
| Date | Buyer | Sale Price | Title Company |
|---|---|---|---|
| Ineson Dianna K | -- | -- | |
| Ineson Peter M | $83,000 | -- | |
| Bsi Financial Svcs Inc | -- | -- | |
| Palmer Stephen Russell | $138,500 | -- | |
| Duggan John A | $109,000 | -- |
Source: Public Records
Mortgage History
| Date | Status | Borrower | Loan Amount |
|---|---|---|---|
| Previous Owner | Ineson Peter M | $123,000 |
Source: Public Records
Tax History Compared to Growth
Tax History
| Year | Tax Paid | Tax Assessment Tax Assessment Total Assessment is a certain percentage of the fair market value that is determined by local assessors to be the total taxable value of land and additions on the property. | Land | Improvement |
|---|---|---|---|---|
| 2024 | $2,963 | $142,471 | $11,200 | $131,271 |
| 2023 | $2,963 | $105,760 | $11,600 | $94,160 |
| 2022 | $2,034 | $77,533 | $11,600 | $65,933 |
| 2021 | $2,131 | $80,794 | $11,600 | $69,194 |
| 2020 | $2,192 | $80,794 | $11,600 | $69,194 |
| 2019 | $2,223 | $80,794 | $11,600 | $69,194 |
| 2018 | $2,253 | $80,794 | $11,600 | $69,194 |
| 2017 | $1,134 | $45,267 | $8,600 | $36,667 |
| 2016 | $738 | $38,761 | $5,250 | $33,511 |
| 2014 | -- | $62,340 | $5,250 | $57,090 |
| 2013 | -- | $62,339 | $5,250 | $57,089 |
Source: Public Records
Map
Nearby Homes
- 258 Camden Way Unit 67
- 157 Camden Way Unit 9
- 236 Camden Way Unit 51
- 359 Fox Den Cir
- 407 Fox Den Cir
- 367 Fox Den Cir
- 351 Fox Den Cir
- 381 Fox Den Cir
- 407 Dawnville Rd
- 419 Fox Den Cir
- 305 Kay Dr NE
- 431 Fox Den Cir
- 428 Fox Den Cir
- 442 Fox Den Cir
- 447 Fox Den Cir
- 454 Fox Den Cir
- Salem Plan at Fox Hollow
- Hanover Plan at Fox Hollow
- Freeport Plan at Fox Hollow
- Belhaven Plan at Fox Hollow
- 1419 Thrasher Hills Dr NE
- 1423 Thrasher Hills Dr NE
- 1423 Thrasher Hills Rd NE
- 1422 Thrasher Hills Dr NE
- 1422 Thrasher Hills Rd NE
- 1413 Thrasher Hills Dr NE
- 1420 Thrasher Hills Dr NE
- 1426 Thrasher Hills Dr NE
- 1426 Thrasher Hills Rd NE
- 307 Pheasant Dr
- 314 Quail Dr NE
- 313 Quail Dr NE
- 1470 Pleasant Grove Dr NE
- 1428 Thrasher Hills Dr NE
- 1416 Thrasher Hills Dr NE
- 309 Pheasant Dr
- 1423 NE Thrasher Rd
- 1454 Pleasant Grove Dr NE
- 1414 Thrasher Hills Dr NE
- 1431 Thrasher Hills Dr NE