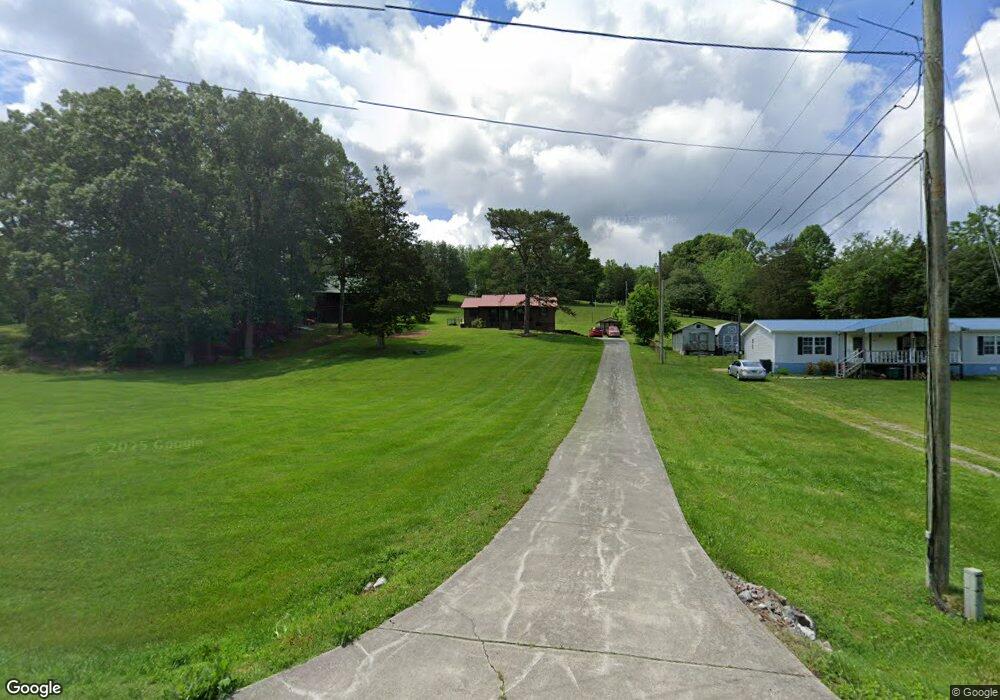
1423 Cain Mill Rd Russellville, TN 37860
Estimated Value: $177,000 - $279,000
--
Bed
2
Baths
1,248
Sq Ft
$199/Sq Ft
Est. Value
About This Home
This home is located at 1423 Cain Mill Rd, Russellville, TN 37860 and is currently estimated at $248,005, approximately $198 per square foot. 1423 Cain Mill Rd is a home located in Hamblen County with nearby schools including Russellville Elementary School, East Ridge Middle School, and Morristown East High School.
Ownership History
Date
Name
Owned For
Owner Type
Purchase Details
Closed on
Jun 23, 2011
Sold by
Brown Bonnie
Bought by
Wolfe Marti E
Current Estimated Value
Home Financials for this Owner
Home Financials are based on the most recent Mortgage that was taken out on this home.
Original Mortgage
$84,000
Outstanding Balance
$57,881
Interest Rate
4.62%
Mortgage Type
Commercial
Estimated Equity
$190,124
Purchase Details
Closed on
Jan 27, 2006
Sold by
Jones Paul Jeffrey
Bought by
Bonnie Brown
Home Financials for this Owner
Home Financials are based on the most recent Mortgage that was taken out on this home.
Original Mortgage
$125,100
Interest Rate
10.25%
Purchase Details
Closed on
Aug 1, 1983
Bought by
Jones Paul Jeffrey
Purchase Details
Closed on
May 26, 1983
Bought by
Coffey Coffey G and Coffey Georgia
Purchase Details
Closed on
May 16, 1981
Bought by
Smith Ronnie and Smith Joyce
Purchase Details
Closed on
Nov 10, 1975
Bought by
Harrell Glen and Harrell Dorothy
Create a Home Valuation Report for This Property
The Home Valuation Report is an in-depth analysis detailing your home's value as well as a comparison with similar homes in the area
Home Values in the Area
Average Home Value in this Area
Purchase History
| Date | Buyer | Sale Price | Title Company |
|---|---|---|---|
| Wolfe Marti E | $87,000 | -- | |
| Bonnie Brown | $139,000 | -- | |
| Jones Paul Jeffrey | $4,500 | -- | |
| Coffey Coffey G | -- | -- | |
| Smith Ronnie | -- | -- | |
| Harrell Glen | -- | -- |
Source: Public Records
Mortgage History
| Date | Status | Borrower | Loan Amount |
|---|---|---|---|
| Open | Wolfe Marti E | $84,000 | |
| Previous Owner | Harrell Glen | $125,100 |
Source: Public Records
Tax History Compared to Growth
Tax History
| Year | Tax Paid | Tax Assessment Tax Assessment Total Assessment is a certain percentage of the fair market value that is determined by local assessors to be the total taxable value of land and additions on the property. | Land | Improvement |
|---|---|---|---|---|
| 2024 | $562 | $28,550 | $3,750 | $24,800 |
| 2023 | $562 | $28,550 | $0 | $0 |
| 2022 | $562 | $28,550 | $3,750 | $24,800 |
| 2021 | $562 | $28,550 | $3,750 | $24,800 |
| 2020 | $562 | $28,550 | $3,750 | $24,800 |
| 2019 | $541 | $25,400 | $3,750 | $21,650 |
| 2018 | $541 | $25,400 | $3,750 | $21,650 |
| 2017 | $541 | $25,400 | $3,750 | $21,650 |
| 2016 | $505 | $25,400 | $3,750 | $21,650 |
| 2015 | $470 | $25,400 | $3,750 | $21,650 |
| 2014 | -- | $25,400 | $3,750 | $21,650 |
| 2013 | -- | $29,500 | $0 | $0 |
Source: Public Records
Map
Nearby Homes
- 6975 Brookdell Dr
- 6421 Old Russellville Pike
- 1781 Mullins Rd
- 1936 Turners Landing Rd
- 1650 Mullins Rd
- 6358 Turners Pond Trail
- 6312 Turners Pond Tr
- 6350 Turners Pond Trail
- 1955 Turners Landing Rd
- 1955 Turner Landing Rd
- 2145 Fall Creek Rd
- 6330 Old Russellville Pike
- 6563 E Andrew Johnson Hwy
- 6276 Outlook Trail
- 0 Turner Landing Rd
- 6284 Old Russellville Pike
- 6312 Turners Pond Trail
- 2004 Turners Landing Rd
- 6650 E Andrew Johnson Hwy
- 1987 Turners Landing Rd
- 1405 Cain Mill Rd
- 1461 Cain Mill Rd
- 1471 Cain Mill Rd
- 1424 Cain Mill Rd
- 1450 Cain Mill Rd
- 1410 Cain Mill Rd
- 1400 Cain Mill Rd
- 1470 Cain Mill Rd
- 1455 Cain Mill Rd
- 1537 Cain Mill Rd
- 1348 Cain Mill Rd
- 1549 Cain Mill Rd
- 1563 Cain Mill Rd
- 1233 Cain Mill Rd
- 1287 Cain Mill Rd
- 1571 Cain Mill Rd
- 1277 Cain Mill Rd
- 1201 Cain Mill Rd
- 1583 Cain Mill Rd
- 1221 Cain Mill Rd