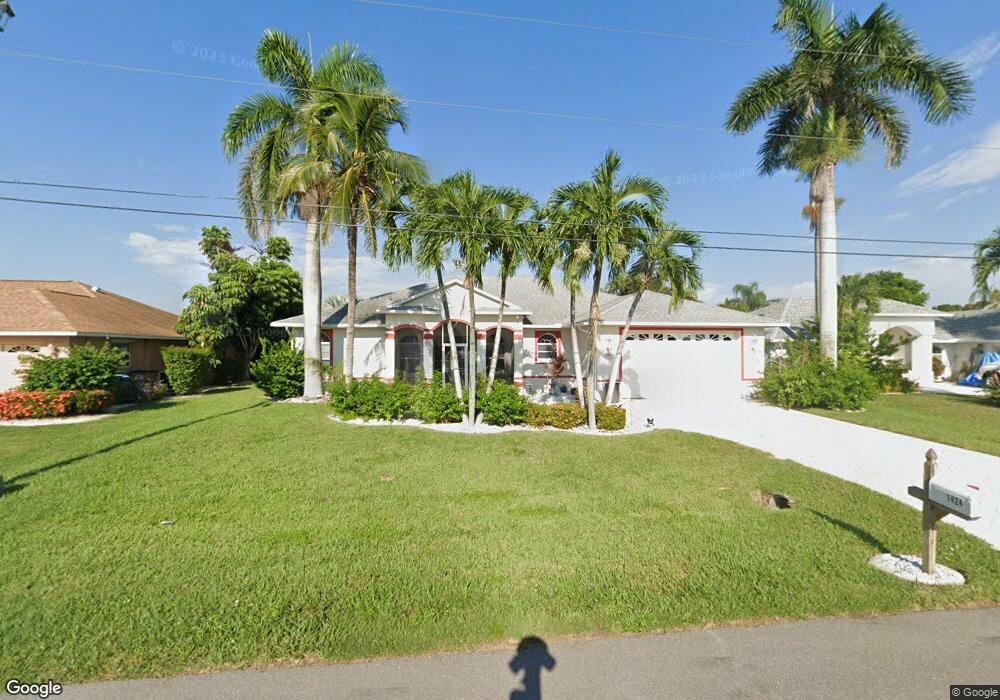
1424 SE 11th Place Cape Coral, FL 33990
Hancock NeighborhoodEstimated Value: $489,802 - $606,000
3
Beds
2
Baths
2,782
Sq Ft
$199/Sq Ft
Est. Value
About This Home
This home is located at 1424 SE 11th Place, Cape Coral, FL 33990 and is currently estimated at $554,451, approximately $199 per square foot. 1424 SE 11th Place is a home located in Lee County with nearby schools including Caloosa Elementary School, Cape Elementary School, and Tropic Isles Elementary School.
Ownership History
Date
Name
Owned For
Owner Type
Purchase Details
Closed on
Jul 19, 2022
Sold by
Cassidy Peter J and Cassidy Dolores A
Bought by
Cassidy Irrevocable Asset Management Trust
Current Estimated Value
Purchase Details
Closed on
Oct 18, 2021
Sold by
Cassidy Peter J and Cassidy Dolores A
Bought by
Cassidy Peter J and Cassidy Dolores A
Home Financials for this Owner
Home Financials are based on the most recent Mortgage that was taken out on this home.
Original Mortgage
$283,000
Interest Rate
2.8%
Mortgage Type
New Conventional
Purchase Details
Closed on
Aug 19, 2004
Sold by
Peers Consulting Inc
Bought by
Sikut John E and Sikut Diane L
Home Financials for this Owner
Home Financials are based on the most recent Mortgage that was taken out on this home.
Original Mortgage
$175,000
Interest Rate
4.5%
Mortgage Type
Unknown
Create a Home Valuation Report for This Property
The Home Valuation Report is an in-depth analysis detailing your home's value as well as a comparison with similar homes in the area
Home Values in the Area
Average Home Value in this Area
Purchase History
| Date | Buyer | Sale Price | Title Company |
|---|---|---|---|
| Cassidy Irrevocable Asset Management Trust | -- | Ronald J Schwartz Pc | |
| Cassidy Peter J | -- | Avenue 365 Lender Svcs Llc | |
| Sikut John E | $445,000 | Guardian Title Services Corp |
Source: Public Records
Mortgage History
| Date | Status | Borrower | Loan Amount |
|---|---|---|---|
| Previous Owner | Cassidy Peter J | $283,000 | |
| Previous Owner | Sikut John E | $175,000 |
Source: Public Records
Tax History Compared to Growth
Tax History
| Year | Tax Paid | Tax Assessment Tax Assessment Total Assessment is a certain percentage of the fair market value that is determined by local assessors to be the total taxable value of land and additions on the property. | Land | Improvement |
|---|---|---|---|---|
| 2025 | $8,205 | $466,501 | $151,003 | $252,315 |
| 2024 | $9,651 | $468,446 | $142,890 | $256,995 |
| 2023 | $9,651 | $557,026 | $229,470 | $280,200 |
| 2022 | $7,810 | $400,604 | $0 | $0 |
| 2021 | $6,923 | $364,726 | $103,010 | $261,716 |
| 2020 | $6,572 | $331,077 | $74,000 | $257,077 |
| 2019 | $6,217 | $313,305 | $64,000 | $249,305 |
| 2018 | $6,362 | $314,109 | $64,000 | $250,109 |
| 2017 | $6,039 | $290,693 | $62,000 | $228,693 |
| 2016 | $6,225 | $297,708 | $77,758 | $219,950 |
| 2015 | $5,893 | $273,991 | $74,145 | $199,846 |
| 2014 | -- | $263,385 | $73,010 | $190,375 |
| 2013 | -- | $273,405 | $64,916 | $208,489 |
Source: Public Records
Map
Nearby Homes
- 1416 SE 11th Place
- 1024 SE 14th Terrace
- 1518 SE 11th Ave
- 1903 SE 13th Terrace
- 1939 SE 10th Ave
- 222 SE 10th Ave
- 1216 SE 13th Ave
- 307 SE 13th St
- 1234 SE 13th Ave
- 1215 SE 16th St
- 1001 SE 12th Ln
- 1318 SE 14th St
- 1104 SE 16th Terrace
- 1314 SE 15th Terrace
- 911 SE 13th Terrace
- 904 SE 13th St Unit 201
- 919 SE 16th St
- 1039 SE 10th St
- 1404 SE 15th St
- 924 SE 16th St
- 1428 SE 11th Place
- 1420 SE 11th Place
- 1102 SE 14th Terrace
- 1432 SE 11th Place
- 1028 SE 14th Terrace
- 1101 SE 15th St
- 1106 SE 14th Terrace
- 1502 SE 11th Place
- 1413 SE 11 Ave
- 1105 SE 15th St
- 1413 SE 11th Ave
- 1105 SE 14th Terrace
- 1110 SE 14th Terrace
- 1506 SE 11th Place
- 1408 SE 11th Place
- 1102 SE 14th St
- 1023 SE 15th St
- 1409 SE 11th Ave
- 1109 SE 15th St
- 1505 SE 11th Place