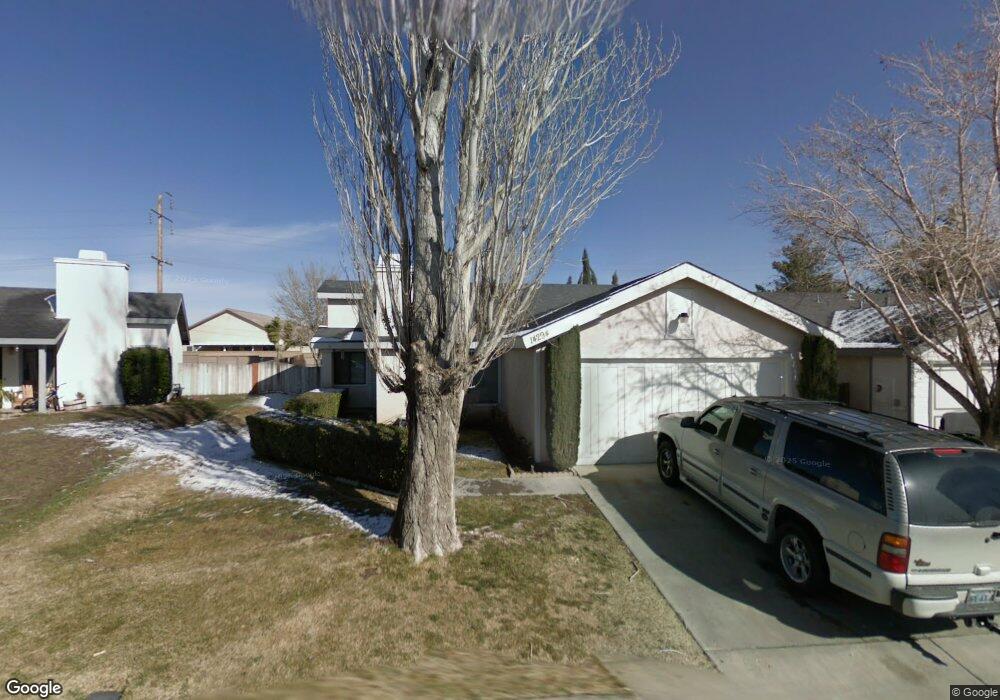
14294 Pinewood Dr Hesperia, CA 92344
High Country NeighborhoodEstimated Value: $351,000 - $397,932
3
Beds
2
Baths
1,159
Sq Ft
$321/Sq Ft
Est. Value
About This Home
This home is located at 14294 Pinewood Dr, Hesperia, CA 92344 and is currently estimated at $372,233, approximately $321 per square foot. 14294 Pinewood Dr is a home located in San Bernardino County with nearby schools including Cottonwood Elementary School, Cedar Middle School, and Oak Hills High School.
Ownership History
Date
Name
Owned For
Owner Type
Purchase Details
Closed on
Aug 9, 2017
Sold by
Mahgerefteh Mousa
Bought by
Hesperia 26 Asset Holdings Llc
Current Estimated Value
Purchase Details
Closed on
Aug 23, 2011
Sold by
Federal National Mortgage Association
Bought by
Mousa Mahgerefteh 26 Prms Properties Llc
Purchase Details
Closed on
Mar 31, 2011
Sold by
Neeley Brian K and Neeley Shylo M
Bought by
Federal National Mortgage Association
Purchase Details
Closed on
Jan 25, 2001
Sold by
Gale Scott D and Gale Martha L
Bought by
Neeley Brian K and Neeley Shylo M
Home Financials for this Owner
Home Financials are based on the most recent Mortgage that was taken out on this home.
Original Mortgage
$74,335
Interest Rate
7.09%
Mortgage Type
FHA
Create a Home Valuation Report for This Property
The Home Valuation Report is an in-depth analysis detailing your home's value as well as a comparison with similar homes in the area
Home Values in the Area
Average Home Value in this Area
Purchase History
| Date | Buyer | Sale Price | Title Company |
|---|---|---|---|
| Hesperia 26 Asset Holdings Llc | -- | None Available | |
| Mousa Mahgerefteh 26 Prms Properties Llc | $64,000 | Stewart Title Of California | |
| Federal National Mortgage Association | $50,900 | Landsafe Title | |
| Neeley Brian K | $75,000 | Chicago Title Co |
Source: Public Records
Mortgage History
| Date | Status | Borrower | Loan Amount |
|---|---|---|---|
| Previous Owner | Neeley Brian K | $74,335 |
Source: Public Records
Tax History Compared to Growth
Tax History
| Year | Tax Paid | Tax Assessment Tax Assessment Total Assessment is a certain percentage of the fair market value that is determined by local assessors to be the total taxable value of land and additions on the property. | Land | Improvement |
|---|---|---|---|---|
| 2025 | $926 | $80,388 | $16,329 | $64,059 |
| 2024 | $926 | $78,812 | $16,009 | $62,803 |
| 2023 | $916 | $77,267 | $15,695 | $61,572 |
| 2022 | $896 | $75,752 | $15,387 | $60,365 |
| 2021 | $881 | $74,266 | $15,085 | $59,181 |
| 2020 | $871 | $73,504 | $14,930 | $58,574 |
| 2019 | $854 | $72,062 | $14,637 | $57,425 |
| 2018 | $839 | $70,649 | $14,350 | $56,299 |
| 2017 | $825 | $69,264 | $14,069 | $55,195 |
| 2016 | $808 | $67,906 | $13,793 | $54,113 |
| 2015 | $798 | $66,886 | $13,586 | $53,300 |
| 2014 | $788 | $65,576 | $13,320 | $52,256 |
Source: Public Records
Map
Nearby Homes
- 0 Tamarisk Ave Unit HD23052637
- 14131 Desert Rose St
- 8792 Newcastle Ave
- 9143 Ocotillo Ave
- 14572 Sultana St
- 14073 Ruby St
- 0 Olive St
- 14122 Hartford St
- 14110 Hartford St
- 9454 Apricot Ct
- 8843 Newcastle Ave
- Agate Plan at Seasons at Topaz
- 8800 Newcastle Ave
- 14191 Hartford St
- 8863 Glencliff Ave
- Ammolite HX Plan at Seasons at Topaz
- 14415 Hartford St
- 8846 Tamarisk Ave
- 14148 Hartford St
- 0 Orange St Unit CV25173962
- 14296 Pinewood Dr
- 14292 Pinewood Dr
- 14286 Pinewood Dr
- 14289 Desert Rose St
- 0 Tamarisk Ave Unit WS18192515
- 0 Tamarisk Ave Unit OC17250504
- 0 Tamarisk Ave Unit AR13091251
- 0 Tamarisk Ave Unit IV13234019
- 0 Riverside Tamarisk Unit CV14179135
- 0 Riverside Tamarisk Unit CV14179133
- 0 Tamarisk Ave Unit CV15092672
- 0 Tamarisk Ave Unit CV16160970
- 0 Tamarisk Ave Unit CV17151681
- 0 Tamarisk Ave Unit CV25202774
- 0 Tamarisk Ave Unit CRHD25054481
- 0 Tamarisk Ave Unit CRHD23052637
- 0 Tamarisk Ave Unit CRCV25013146
- 0 Tamarisk Ave Unit CV25013146
- 0 Tamarisk Ave Unit CRHD24035393
- 0 Tamarisk Ave Unit CRCV24007414