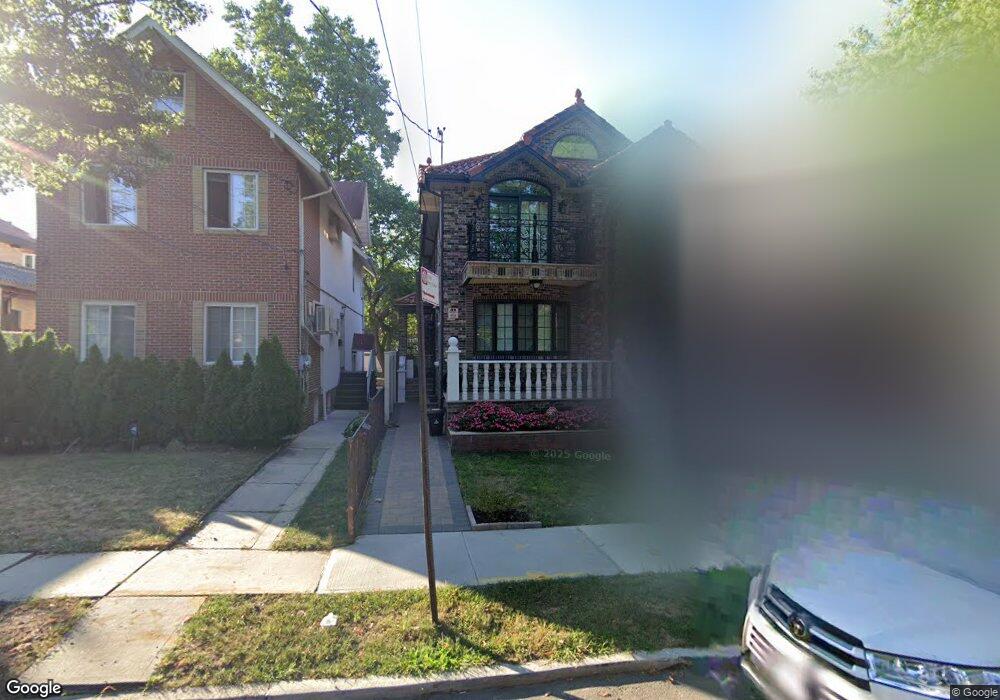
143-06 Quince Ave Unit 1F Flushing, NY 11355
Flushing NeighborhoodEstimated Value: $1,736,001 - $2,294,000
3
Beds
2
Baths
3,224
Sq Ft
$654/Sq Ft
Est. Value
About This Home
This home is located at 143-06 Quince Ave Unit 1F, Flushing, NY 11355 and is currently estimated at $2,107,500, approximately $653 per square foot. 143-06 Quince Ave Unit 1F is a home located in Queens County with nearby schools including P.S. 024 Andrew Jackson School, Rachel Carson I.S. 237Q, and Francis Lewis High School.
Ownership History
Date
Name
Owned For
Owner Type
Purchase Details
Closed on
Dec 11, 2012
Sold by
Hau Sau Ying and Zhu Jun Ge
Bought by
Zhu Jun Ge
Current Estimated Value
Purchase Details
Closed on
Jul 19, 2012
Sold by
Zhu Jun Ge
Bought by
Hau Sau Ying and Zhu Jun Ge
Home Financials for this Owner
Home Financials are based on the most recent Mortgage that was taken out on this home.
Original Mortgage
$83,959
Interest Rate
3.61%
Mortgage Type
New Conventional
Purchase Details
Closed on
Apr 20, 2010
Sold by
Haraj Delilah and Haraj Khalid
Bought by
Zhu Jun Ge
Home Financials for this Owner
Home Financials are based on the most recent Mortgage that was taken out on this home.
Original Mortgage
$325,000
Interest Rate
5.03%
Mortgage Type
Purchase Money Mortgage
Purchase Details
Closed on
Aug 17, 2009
Sold by
Ramdehaul Lucy and Ramdehaul Seowdayal
Bought by
Haraj Delilah and Haraj Khalid
Create a Home Valuation Report for This Property
The Home Valuation Report is an in-depth analysis detailing your home's value as well as a comparison with similar homes in the area
Home Values in the Area
Average Home Value in this Area
Purchase History
| Date | Buyer | Sale Price | Title Company |
|---|---|---|---|
| Zhu Jun Ge | -- | -- | |
| Hau Sau Ying | -- | -- | |
| Zhu Jun Ge | $745,000 | -- | |
| Haraj Delilah | $565,000 | -- |
Source: Public Records
Mortgage History
| Date | Status | Borrower | Loan Amount |
|---|---|---|---|
| Previous Owner | Hau Sau Ying | $83,959 | |
| Previous Owner | Zhu Jun Ge | $325,000 |
Source: Public Records
Tax History Compared to Growth
Tax History
| Year | Tax Paid | Tax Assessment Tax Assessment Total Assessment is a certain percentage of the fair market value that is determined by local assessors to be the total taxable value of land and additions on the property. | Land | Improvement |
|---|---|---|---|---|
| 2025 | $14,143 | $74,641 | $22,641 | $52,000 |
| 2024 | $14,143 | $70,416 | $22,109 | $48,307 |
| 2023 | $14,143 | $70,416 | $24,226 | $46,190 |
| 2022 | $10,543 | $87,180 | $36,000 | $51,180 |
| 2021 | $14,819 | $82,380 | $36,000 | $46,380 |
| 2020 | $13,312 | $78,240 | $36,000 | $42,240 |
| 2019 | $5,058 | $24,180 | $19,200 | $4,980 |
| 2018 | $7,439 | $36,494 | $11,132 | $25,362 |
| 2017 | $7,439 | $36,494 | $14,543 | $21,951 |
| 2016 | $7,241 | $36,494 | $14,543 | $21,951 |
| 2015 | $4,152 | $34,170 | $15,592 | $18,578 |
| 2014 | $4,152 | $32,236 | $17,660 | $14,576 |
Source: Public Records
Map
Nearby Homes
- 52-06 Bowne St
- 52-05 Robinson St
- 140-50 Quince Ave
- 14335 Poplar Ave
- 140-19 Rose Ave
- 140-24 Quince Ave
- 14014 Poplar Ave
- 140-03 Poplar Ave
- 157-51 Rose Ave
- 14014 Negundo Ave
- 50-16 Kissena Blvd
- 152-10 Peck Ave
- 5423 153rd St
- 54-13 152nd St
- 157-18 Laburnum Ave
- 15110 Peck Ave
- 148-29 Laburnum Ave
- 54-29 153rd St
- 54-25 152nd St
- 14824 Kalmia Ave
- 14306 Quince Ave
- 143-12 Quince Ave Unit 2
- 143-12 Quince Ave Unit 1
- 143-12 Quince Ave
- 14312 Quince Ave
- 14302 Quince Ave
- 14314 Quince Ave
- 14316 Quince Ave
- 14307 Rose Ave
- 5215 Bowne St
- 52-15 Bowne St
- 14309 Rose Ave
- 143-09 Rose Ave
- 14315 Rose Ave
- 14320 Quince Ave
- 5119 Bowne St
- 143-15 Rose Ave
- 5206 Bowne St
- 51-15 Bowne St Unit 1&2
- 5115 Bowne St