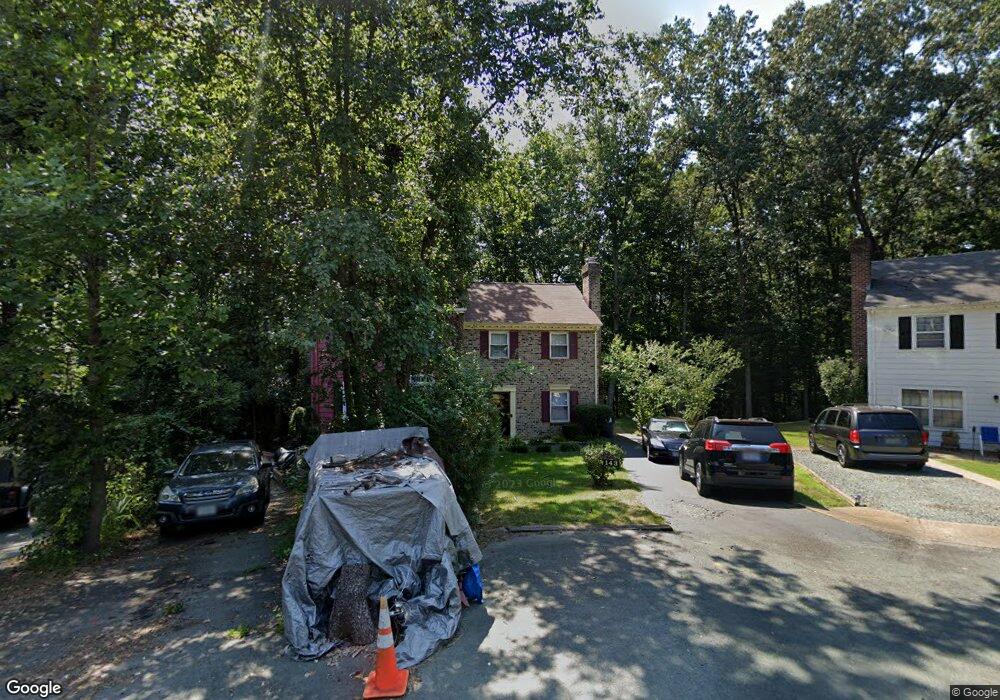
143 Quince Ln Charlottesville, VA 22902
Southeast Charlottesville NeighborhoodEstimated Value: $330,000 - $403,000
3
Beds
2
Baths
1,200
Sq Ft
$293/Sq Ft
Est. Value
About This Home
This home is located at 143 Quince Ln, Charlottesville, VA 22902 and is currently estimated at $351,926, approximately $293 per square foot. 143 Quince Ln is a home located in Albemarle County with nearby schools including Mountain View Elementary School, Jackson P. Burley Middle School, and Monticello High School.
Ownership History
Date
Name
Owned For
Owner Type
Purchase Details
Closed on
Mar 21, 2012
Sold by
White Althea L and Brooks Althia W
Bought by
Brooks Althea W
Current Estimated Value
Home Financials for this Owner
Home Financials are based on the most recent Mortgage that was taken out on this home.
Original Mortgage
$149,708
Interest Rate
4.4%
Mortgage Type
FHA
Create a Home Valuation Report for This Property
The Home Valuation Report is an in-depth analysis detailing your home's value as well as a comparison with similar homes in the area
Home Values in the Area
Average Home Value in this Area
Purchase History
| Date | Buyer | Sale Price | Title Company |
|---|---|---|---|
| Brooks Althea W | -- | Stewart Title Guaranty Co |
Source: Public Records
Mortgage History
| Date | Status | Borrower | Loan Amount |
|---|---|---|---|
| Closed | Brooks Althea W | $149,708 |
Source: Public Records
Tax History Compared to Growth
Tax History
| Year | Tax Paid | Tax Assessment Tax Assessment Total Assessment is a certain percentage of the fair market value that is determined by local assessors to be the total taxable value of land and additions on the property. | Land | Improvement |
|---|---|---|---|---|
| 2025 | $2,796 | $312,800 | $90,000 | $222,800 |
| 2024 | -- | $260,400 | $82,000 | $178,400 |
| 2023 | $2,168 | $253,900 | $83,000 | $170,900 |
| 2022 | $1,947 | $228,000 | $80,000 | $148,000 |
| 2021 | $1,622 | $189,900 | $60,000 | $129,900 |
| 2020 | $1,613 | $188,900 | $67,500 | $121,400 |
| 2019 | $1,548 | $181,300 | $67,500 | $113,800 |
| 2018 | $1,287 | $154,000 | $60,000 | $94,000 |
| 2017 | $1,283 | $152,900 | $45,000 | $107,900 |
| 2016 | $1,161 | $138,400 | $45,000 | $93,400 |
| 2015 | $554 | $135,300 | $45,000 | $90,300 |
| 2014 | -- | $134,100 | $45,000 | $89,100 |
Source: Public Records
Map
Nearby Homes