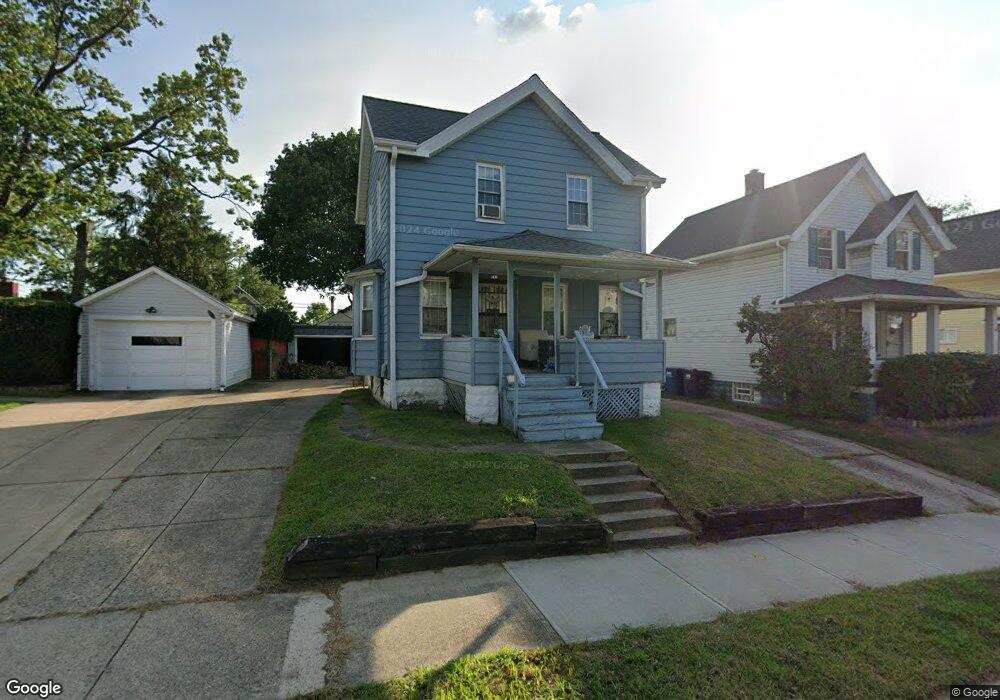
1430 Gridley St Lakewood, OH 44107
Estimated Value: $202,287 - $297,000
2
Beds
1
Bath
972
Sq Ft
$260/Sq Ft
Est. Value
About This Home
This home is located at 1430 Gridley St, Lakewood, OH 44107 and is currently estimated at $252,822, approximately $260 per square foot. 1430 Gridley St is a home located in Cuyahoga County with nearby schools including Horace Mann Elementary School, Harding Middle School, and Lakewood High School.
Ownership History
Date
Name
Owned For
Owner Type
Purchase Details
Closed on
Sep 12, 2001
Sold by
Mcfadden Molly A and Mcfaden Molly A
Bought by
Dixit Sandeep and Dixit Vaishali
Current Estimated Value
Home Financials for this Owner
Home Financials are based on the most recent Mortgage that was taken out on this home.
Original Mortgage
$90,900
Outstanding Balance
$35,549
Interest Rate
7.03%
Estimated Equity
$217,273
Purchase Details
Closed on
Apr 19, 1996
Sold by
Mussetter Donald
Bought by
Mcfadden Molly A
Home Financials for this Owner
Home Financials are based on the most recent Mortgage that was taken out on this home.
Original Mortgage
$77,914
Interest Rate
7.44%
Mortgage Type
FHA
Purchase Details
Closed on
Aug 27, 1984
Sold by
Jacklitch Laverne J
Bought by
Mussetter Donald E
Purchase Details
Closed on
Jan 1, 1975
Bought by
Jacklitch Laverne J
Create a Home Valuation Report for This Property
The Home Valuation Report is an in-depth analysis detailing your home's value as well as a comparison with similar homes in the area
Home Values in the Area
Average Home Value in this Area
Purchase History
| Date | Buyer | Sale Price | Title Company |
|---|---|---|---|
| Dixit Sandeep | $101,000 | City Title Company Agency In | |
| Mcfadden Molly A | $78,000 | -- | |
| Mussetter Donald E | $44,000 | -- | |
| Jacklitch Laverne J | -- | -- |
Source: Public Records
Mortgage History
| Date | Status | Borrower | Loan Amount |
|---|---|---|---|
| Open | Dixit Sandeep | $90,900 | |
| Previous Owner | Mcfadden Molly A | $77,914 |
Source: Public Records
Tax History Compared to Growth
Tax History
| Year | Tax Paid | Tax Assessment Tax Assessment Total Assessment is a certain percentage of the fair market value that is determined by local assessors to be the total taxable value of land and additions on the property. | Land | Improvement |
|---|---|---|---|---|
| 2024 | $4,443 | $69,160 | $13,965 | $55,195 |
| 2023 | $4,581 | $61,040 | $11,830 | $49,210 |
| 2022 | $4,611 | $61,040 | $11,830 | $49,210 |
| 2021 | $4,564 | $61,040 | $11,830 | $49,210 |
| 2020 | $4,047 | $47,320 | $9,170 | $38,150 |
| 2019 | $3,967 | $135,200 | $26,200 | $109,000 |
| 2018 | $3,961 | $47,320 | $9,170 | $38,150 |
| 2017 | $3,567 | $38,710 | $7,070 | $31,640 |
| 2016 | $3,542 | $38,710 | $7,070 | $31,640 |
| 2015 | $3,207 | $38,710 | $7,070 | $31,640 |
| 2014 | $3,207 | $33,670 | $6,160 | $27,510 |
Source: Public Records
Map
Nearby Homes
- 1422 Gridley St
- 1416 Rio St
- 1464 Riverside Dr
- 1431 Maile Ave
- 1350 Edanola Ave
- 18699 High Pkwy
- 18820 High Pkwy
- 19000 Lake Rd Unit 915
- 18239 Sloane Ave
- 1482 Rockway Ave
- 416 Riverdale Dr
- 1462 Spring Garden Ave
- 387 S Island Dr
- 17322 Archdale Ave
- 0 Riverdale Dr Unit 5078145
- 0 Riverdale Dr
- 1354 Webb Rd
- 1279 Arlington Rd
- 19204 Frazier Dr
- 2111 Overbrook Ave