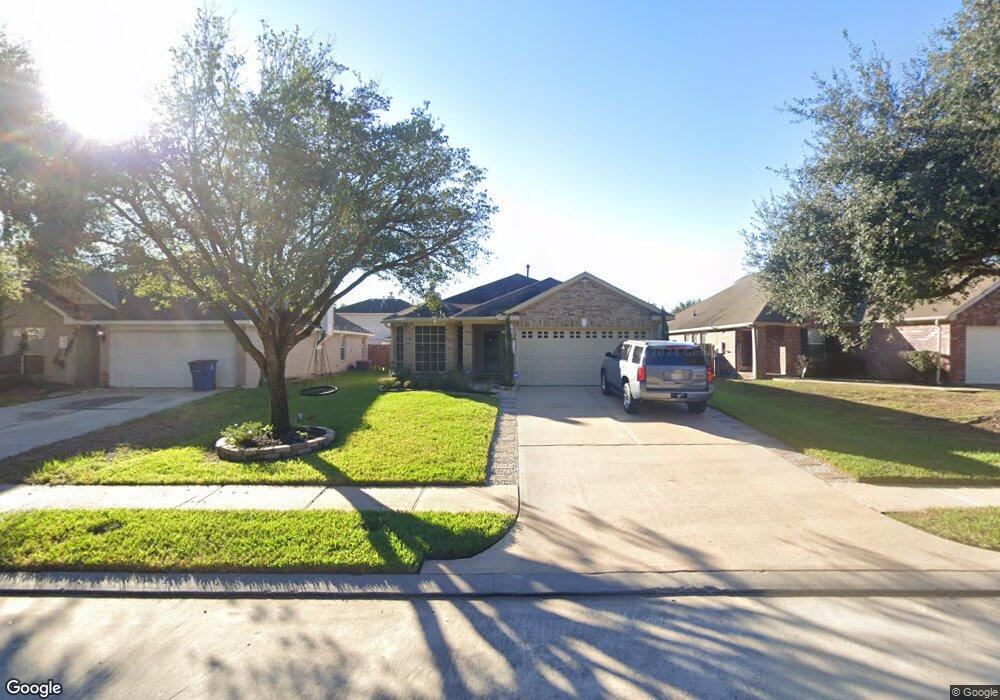
1430 Rocky Glen Ln Spring, TX 77373
Estimated Value: $221,240 - $236,000
3
Beds
2
Baths
1,398
Sq Ft
$164/Sq Ft
Est. Value
About This Home
This home is located at 1430 Rocky Glen Ln, Spring, TX 77373 and is currently estimated at $229,560, approximately $164 per square foot. 1430 Rocky Glen Ln is a home located in Harris County with nearby schools including Ginger McNabb Elementary School, Twin Creeks Middle School, and Spring High School.
Ownership History
Date
Name
Owned For
Owner Type
Purchase Details
Closed on
Jun 26, 2019
Sold by
Majano Andres and Majano Elida Isabel
Bought by
Gutierrez Majano Maria Isabel and Gutierrez Perez Aaron
Current Estimated Value
Purchase Details
Closed on
Feb 7, 2005
Sold by
Majano Andres and Majano Elida Isabel
Bought by
Recinos Maria Majano
Home Financials for this Owner
Home Financials are based on the most recent Mortgage that was taken out on this home.
Original Mortgage
$92,840
Outstanding Balance
$51,755
Interest Rate
7.25%
Mortgage Type
Purchase Money Mortgage
Estimated Equity
$177,805
Purchase Details
Closed on
Jan 31, 2005
Sold by
D R Horton Texas Ltd
Bought by
Majano Andres
Home Financials for this Owner
Home Financials are based on the most recent Mortgage that was taken out on this home.
Original Mortgage
$92,840
Outstanding Balance
$51,755
Interest Rate
7.25%
Mortgage Type
Purchase Money Mortgage
Estimated Equity
$177,805
Create a Home Valuation Report for This Property
The Home Valuation Report is an in-depth analysis detailing your home's value as well as a comparison with similar homes in the area
Home Values in the Area
Average Home Value in this Area
Purchase History
| Date | Buyer | Sale Price | Title Company |
|---|---|---|---|
| Gutierrez Majano Maria Isabel | -- | None Available | |
| Recinos Maria Majano | $116,051 | -- | |
| Majano Andres | -- | Dhi Title |
Source: Public Records
Mortgage History
| Date | Status | Borrower | Loan Amount |
|---|---|---|---|
| Open | Majano Andres | $92,840 | |
| Closed | Majano Andres | $23,210 | |
| Closed | Recinos Maria Majano | $0 |
Source: Public Records
Tax History Compared to Growth
Tax History
| Year | Tax Paid | Tax Assessment Tax Assessment Total Assessment is a certain percentage of the fair market value that is determined by local assessors to be the total taxable value of land and additions on the property. | Land | Improvement |
|---|---|---|---|---|
| 2025 | $4,281 | $222,210 | $52,668 | $169,542 |
| 2024 | $4,281 | $209,861 | $52,668 | $157,193 |
| 2023 | $4,281 | $220,671 | $52,668 | $168,003 |
| 2022 | $4,852 | $180,090 | $26,534 | $153,556 |
| 2021 | $4,666 | $154,163 | $27,930 | $126,233 |
| 2020 | $4,629 | $145,633 | $27,930 | $117,703 |
| 2019 | $4,327 | $131,132 | $25,975 | $105,157 |
| 2018 | $1,100 | $138,420 | $27,930 | $110,490 |
| 2017 | $3,573 | $138,420 | $27,930 | $110,490 |
| 2016 | $3,248 | $124,729 | $27,930 | $96,799 |
| 2015 | $2,439 | $116,761 | $27,930 | $88,831 |
| 2014 | $2,439 | $97,271 | $27,930 | $69,341 |
Source: Public Records
Map
Nearby Homes
- 1406 High Thicket Ct
- 22543 Sweetglen Ct
- 1419 High Thicket Ct
- 22419 Highfield Ridge Ln
- 22730 Sunset Glen Ln
- 1314 Green Highland Dr
- 1418 Green Highland Dr
- 22902 Jetty Manor Ln
- 22903 Jetty Manor Ln
- 1203 Burnwood Ln
- 22318 Greenbrook Dr
- 22222 Greenbrook Dr
- 1119 Calderwood Dr
- 1206 Lynwood Rd
- 22010 Great Royal Ln
- 22006 Great Royal Ln
- 22007 Imperious Pkwy
- 22015 Sovereign Heights Ln
- 23019 Bridgewater Dr
- 1006 Glouchester Ln
- 1434 Rocky Glen Ln
- 1426 Rocky Glen Ln
- 1438 Rocky Glen Ln
- 1422 Rocky Glen Ln
- 1415 Merryglen Ct
- 1419 Merryglen Ct
- 1411 Merryglen Ct
- 1423 Merryglen Ct
- 1418 Rocky Glen Ln
- 1407 Merryglen Ct
- 1431 Rocky Glen Ln
- 22502 Rocky Glen Ct
- 1435 Rocky Glen Ln
- 1414 Rocky Glen Ln
- 1403 Merryglen Ct
- 22518 Highfield Ridge Ln
- 22514 Highfield Ridge Ln
- 22522 Highfield Ridge Ln
- 22510 Highfield Ridge Ln
- 1410 Rocky Glen Ln