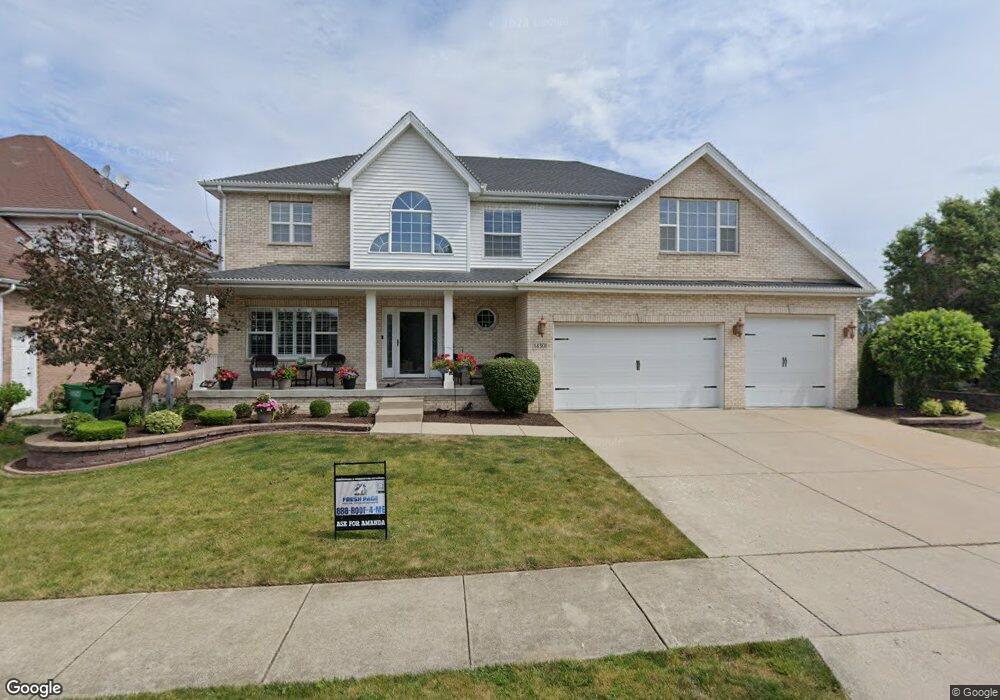
14301 Surrey Ct Homer Glen, IL 60491
Estimated Value: $518,670 - $599,000
--
Bed
--
Bath
2,502
Sq Ft
$225/Sq Ft
Est. Value
About This Home
This home is located at 14301 Surrey Ct, Homer Glen, IL 60491 and is currently estimated at $563,418, approximately $225 per square foot. 14301 Surrey Ct is a home located in Will County with nearby schools including Goodings Grove School, Hadley Middle School, and Homer Jr High School.
Ownership History
Date
Name
Owned For
Owner Type
Purchase Details
Closed on
Feb 5, 2014
Sold by
Moorman Michael J and Moorman Eileen C
Bought by
Pellegrini Daniel and Pellegrini Kristie
Current Estimated Value
Home Financials for this Owner
Home Financials are based on the most recent Mortgage that was taken out on this home.
Original Mortgage
$363,298
Outstanding Balance
$274,871
Interest Rate
4.37%
Mortgage Type
FHA
Estimated Equity
$288,547
Purchase Details
Closed on
Apr 13, 2007
Sold by
Pellegrini Daniel and Pellegrini Kristie
Bought by
Moorman Michael J and Moorman Eileen C
Purchase Details
Closed on
May 30, 2002
Sold by
Turnstone Construction Inc
Bought by
Pellegrini Daniel and Pellegrini Kristie
Home Financials for this Owner
Home Financials are based on the most recent Mortgage that was taken out on this home.
Original Mortgage
$295,500
Interest Rate
6.95%
Create a Home Valuation Report for This Property
The Home Valuation Report is an in-depth analysis detailing your home's value as well as a comparison with similar homes in the area
Home Values in the Area
Average Home Value in this Area
Purchase History
| Date | Buyer | Sale Price | Title Company |
|---|---|---|---|
| Pellegrini Daniel | $370,000 | Fidelity National Title | |
| Moorman Michael J | -- | None Available | |
| Pellegrini Daniel | $248,000 | Chicago Title Insurance Co |
Source: Public Records
Mortgage History
| Date | Status | Borrower | Loan Amount |
|---|---|---|---|
| Open | Pellegrini Daniel | $363,298 | |
| Previous Owner | Pellegrini Daniel | $295,500 |
Source: Public Records
Tax History Compared to Growth
Tax History
| Year | Tax Paid | Tax Assessment Tax Assessment Total Assessment is a certain percentage of the fair market value that is determined by local assessors to be the total taxable value of land and additions on the property. | Land | Improvement |
|---|---|---|---|---|
| 2024 | $11,827 | $170,910 | $39,438 | $131,472 |
| 2023 | $11,827 | $154,922 | $35,749 | $119,173 |
| 2022 | $10,803 | $144,652 | $33,379 | $111,273 |
| 2021 | $10,290 | $137,046 | $31,624 | $105,422 |
| 2020 | $9,860 | $132,003 | $30,460 | $101,543 |
| 2019 | $9,380 | $126,987 | $29,303 | $97,684 |
| 2018 | $7,592 | $103,908 | $28,967 | $74,941 |
| 2017 | $7,438 | $100,999 | $28,156 | $72,843 |
| 2016 | $7,238 | $91,954 | $27,217 | $64,737 |
| 2015 | $7,438 | $88,502 | $26,195 | $62,307 |
| 2014 | $7,438 | $86,673 | $25,654 | $61,019 |
| 2013 | $7,438 | $86,673 | $25,654 | $61,019 |
Source: Public Records
Map
Nearby Homes
- 14225 Mallard Dr
- 14124 Pheasant Ln
- 12360 Derby Ln
- 14533 Mallard Dr
- 14042 Churchill Dr
- Fremont Plan at Goodings Grove
- Danbury Plan at Goodings Grove
- Briarcliffe Plan at Goodings Grove
- Calysta Plan at Goodings Grove
- Amberwood Plan at Goodings Grove
- Eden Plan at Goodings Grove
- 11901 Windemere Ct Unit 301
- 14561 S Appaloosa Ln
- 11901 Somerset Rd Unit 2
- 13855 Secretariat Ln
- 11851 Windemere Ct Unit 201
- 14328 Pinewood Dr
- 14405 Creekwood Dr
- 14017 S Belmont Dr
- 14325 S Bell Rd
- 14306 Surrey Ct
- 14305 Surrey Ct
- 14311 Surrey Ct
- 14310 Surrey Ct
- 14317 Surrey Ct
- 14310 Mallard Dr Unit 2A
- 14324 Surrey Ct
- 14316 Surrey Ct
- 14318 Mallard Dr Unit 2A
- 14326 Mallard Dr
- 12320 W 143rd St
- 12324 W 143rd St
- 14224 Mallard Dr
- 14330 Surrey Ct
- 14334 Mallard Dr
- 14329 Surrey Ct
- 14321 Pheasant Ln
- 14329 Pheasant Ln
- 14336 Surrey Ct
- 14342 Mallard Dr