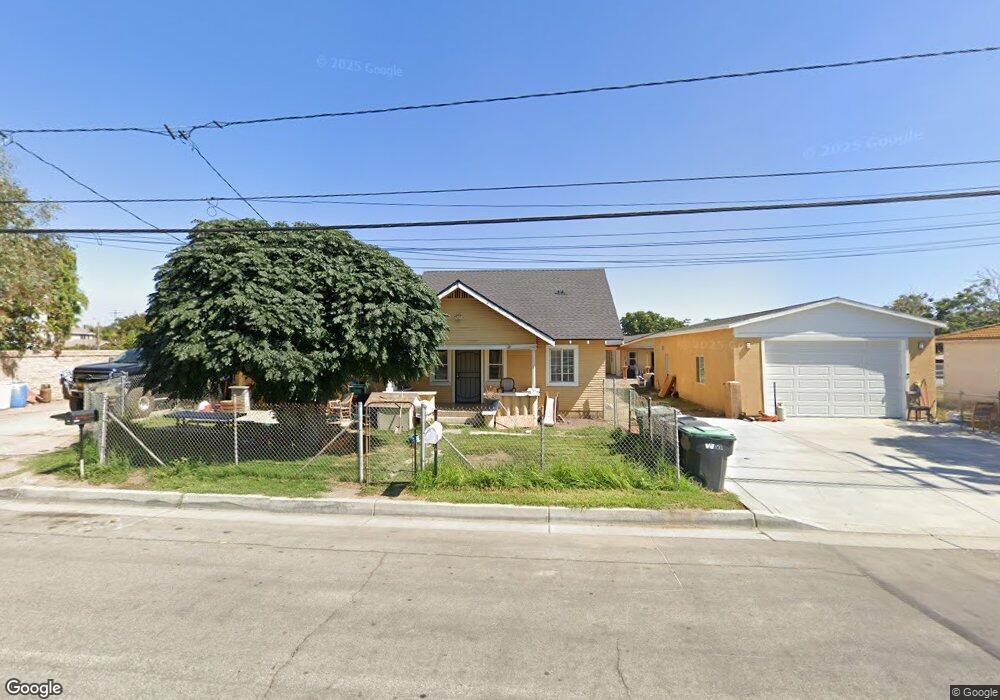
14307 San Antonio Ave Chino, CA 91710
College Park NeighborhoodEstimated Value: $703,000 - $1,022,000
5
Beds
1
Bath
1,806
Sq Ft
$450/Sq Ft
Est. Value
About This Home
This home is located at 14307 San Antonio Ave, Chino, CA 91710 and is currently estimated at $811,812, approximately $449 per square foot. 14307 San Antonio Ave is a home located in San Bernardino County with nearby schools including Edwin Rhodes Elementary, Magnolia Junior High, and Chino High School.
Ownership History
Date
Name
Owned For
Owner Type
Purchase Details
Closed on
Jan 2, 2021
Sold by
Garcia Carlos and Garcia Araceli
Bought by
Garcia Carlos and Garcia Araceli
Current Estimated Value
Home Financials for this Owner
Home Financials are based on the most recent Mortgage that was taken out on this home.
Original Mortgage
$440,000
Outstanding Balance
$392,632
Interest Rate
2.7%
Mortgage Type
New Conventional
Estimated Equity
$419,180
Purchase Details
Closed on
Jul 26, 2005
Sold by
Schuh Harold H
Bought by
Garcia Carlos and Garcia Araceli
Home Financials for this Owner
Home Financials are based on the most recent Mortgage that was taken out on this home.
Original Mortgage
$359,650
Interest Rate
5.46%
Mortgage Type
Balloon
Purchase Details
Closed on
Mar 21, 2002
Sold by
Relova Lam Lia
Bought by
Lam Cyrus Chung
Purchase Details
Closed on
Oct 19, 1994
Sold by
Schuh Harold H
Bought by
Schuh Harold H and Schuh Bernatta M
Create a Home Valuation Report for This Property
The Home Valuation Report is an in-depth analysis detailing your home's value as well as a comparison with similar homes in the area
Home Values in the Area
Average Home Value in this Area
Purchase History
| Date | Buyer | Sale Price | Title Company |
|---|---|---|---|
| Garcia Carlos | -- | Ticor Title | |
| Garcia Carlos | $485,000 | First American Gm | |
| Lam Cyrus Chung | -- | Orange Coast Title | |
| Schuh Harold H | -- | -- | |
| Schuh Harold H | -- | -- |
Source: Public Records
Mortgage History
| Date | Status | Borrower | Loan Amount |
|---|---|---|---|
| Open | Garcia Carlos | $440,000 | |
| Previous Owner | Garcia Carlos | $359,650 |
Source: Public Records
Tax History Compared to Growth
Tax History
| Year | Tax Paid | Tax Assessment Tax Assessment Total Assessment is a certain percentage of the fair market value that is determined by local assessors to be the total taxable value of land and additions on the property. | Land | Improvement |
|---|---|---|---|---|
| 2025 | $5,267 | $562,139 | $159,891 | $402,248 |
| 2024 | $5,267 | $475,626 | $156,755 | $318,871 |
| 2023 | $5,122 | $466,300 | $153,681 | $312,619 |
| 2022 | $5,091 | $457,157 | $150,668 | $306,489 |
| 2021 | $4,992 | $448,193 | $147,714 | $300,479 |
| 2020 | $4,579 | $412,000 | $144,200 | $267,800 |
| 2019 | $4,456 | $400,000 | $140,000 | $260,000 |
| 2018 | $3,658 | $328,800 | $131,000 | $197,800 |
| 2017 | $3,334 | $298,900 | $119,100 | $179,800 |
| 2016 | $3,027 | $284,600 | $113,400 | $171,200 |
| 2015 | $2,868 | $271,000 | $108,000 | $163,000 |
| 2014 | $2,804 | $265,000 | $105,000 | $160,000 |
Source: Public Records
Map
Nearby Homes
- 6570 Encina St
- 14380 Belhaven Ave
- 6685 Eucalyptus Ave
- 14400 Belhaven Ave
- 14170 Durazno Ave
- 6956 Dublin Dr
- 6641 Eucalyptus Ave
- 14349 Guilford Ave
- 6599 Eucalyptus Ave
- 6550 Eucalyptus Ave
- 6501 Wheaton St
- 6781 Vanderbilt St
- 6568 Youngstown St
- 14575 San Antonio Ave
- 6656 Biola St
- 6842 Morehouse St
- 14585 Baylor Ave
- 14551 Longwood Ave Unit 99
- 6958 Clemson St
- 14571 Longwood Ave
- 14331 San Antonio Ave
- 14252 Ironbark Ave
- 6727 Buckeye St
- 14341 San Antonio Ave
- 14379 Bethany Ave
- 14253 Peral Ave
- 6735 Buckeye St
- 14242 Ironbark Ave
- 6680 Wabash St
- 6710 Persimmon Ct
- 6649 Manzano St
- 14243 Peral Ave
- 6720 Persimmon Ct
- 6743 Buckeye St
- 14389 Bethany Ave
- 14232 Ironbark Ave
- 6726 Buckeye St
- 14320 Whitebark Ct
- 14330 Whitebark Ct
- 6802 Persimmon St