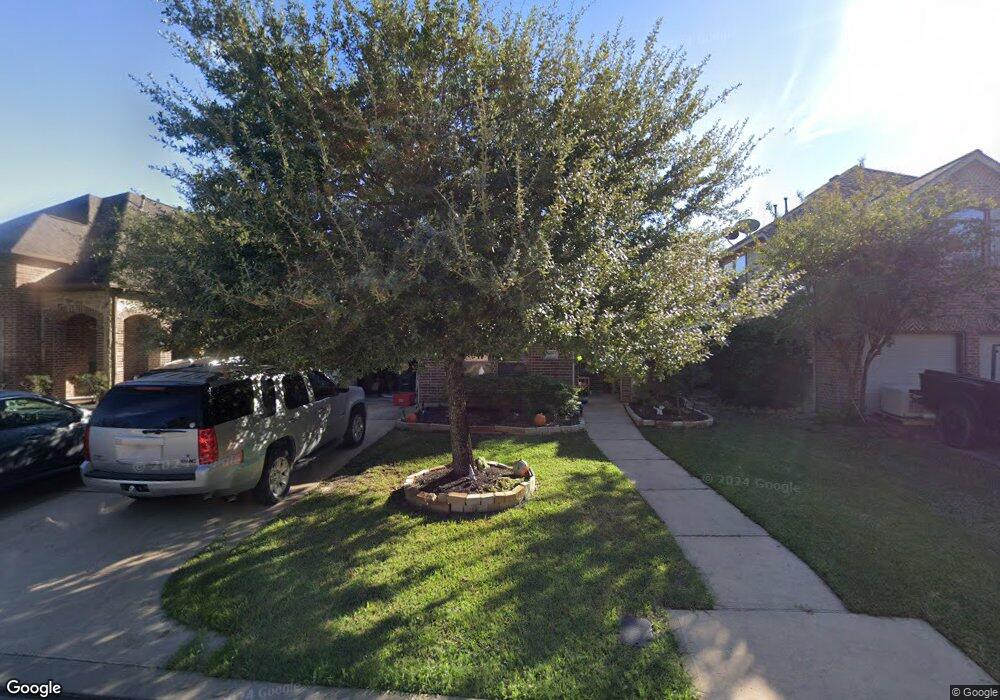
14318 Prosper Ridge Dr Cypress, TX 77429
Estimated Value: $360,933 - $434,000
3
Beds
2
Baths
2,099
Sq Ft
$191/Sq Ft
Est. Value
About This Home
This home is located at 14318 Prosper Ridge Dr, Cypress, TX 77429 and is currently estimated at $399,983, approximately $190 per square foot. 14318 Prosper Ridge Dr is a home located in Harris County with nearby schools including Hamilton Elementary School, Hamilton Middle School, and Cy-Fair High School.
Ownership History
Date
Name
Owned For
Owner Type
Purchase Details
Closed on
Feb 6, 2015
Sold by
Carbajal Mandy
Bought by
Demart Chacory E and Carbajal Mandy
Current Estimated Value
Home Financials for this Owner
Home Financials are based on the most recent Mortgage that was taken out on this home.
Original Mortgage
$184,672
Outstanding Balance
$141,549
Interest Rate
3.78%
Mortgage Type
New Conventional
Estimated Equity
$258,434
Purchase Details
Closed on
Sep 16, 2009
Sold by
Demart Chacory
Bought by
Carbajal Mandy
Purchase Details
Closed on
Oct 30, 2007
Sold by
Darling Homes Of Houston Ltd
Bought by
Demart Chacory E
Home Financials for this Owner
Home Financials are based on the most recent Mortgage that was taken out on this home.
Original Mortgage
$206,150
Interest Rate
6.37%
Mortgage Type
Purchase Money Mortgage
Create a Home Valuation Report for This Property
The Home Valuation Report is an in-depth analysis detailing your home's value as well as a comparison with similar homes in the area
Home Values in the Area
Average Home Value in this Area
Purchase History
| Date | Buyer | Sale Price | Title Company |
|---|---|---|---|
| Demart Chacory E | -- | First American Title Ins Co | |
| Carbajal Mandy | -- | First American Title Ins Co | |
| Carbajal Mandy | -- | None Available | |
| Demart Chacory E | -- | Stewart Title Houston Div |
Source: Public Records
Mortgage History
| Date | Status | Borrower | Loan Amount |
|---|---|---|---|
| Open | Carbajal Mandy | $184,672 | |
| Closed | Demart Chacory E | $184,672 | |
| Previous Owner | Demart Chacory E | $206,150 |
Source: Public Records
Tax History Compared to Growth
Tax History
| Year | Tax Paid | Tax Assessment Tax Assessment Total Assessment is a certain percentage of the fair market value that is determined by local assessors to be the total taxable value of land and additions on the property. | Land | Improvement |
|---|---|---|---|---|
| 2025 | $8,546 | $388,005 | $77,730 | $310,275 |
| 2024 | $8,546 | $388,786 | $70,754 | $318,032 |
| 2023 | $8,546 | $388,786 | $70,754 | $318,032 |
| 2022 | $7,987 | $335,142 | $56,471 | $278,671 |
| 2021 | $6,945 | $274,397 | $56,471 | $217,926 |
| 2020 | $6,176 | $236,683 | $43,848 | $192,835 |
| 2019 | $6,333 | $235,385 | $43,848 | $191,537 |
| 2018 | $3,594 | $249,593 | $43,848 | $205,745 |
| 2017 | $6,717 | $249,593 | $43,848 | $205,745 |
| 2016 | $6,717 | $249,593 | $43,848 | $205,745 |
| 2015 | $4,684 | $237,911 | $43,848 | $194,063 |
| 2014 | $4,684 | $212,278 | $43,848 | $168,430 |
Source: Public Records
Map
Nearby Homes
- 14314 Prosper Ridge Dr
- 14210 Prospect Point Dr
- 13835 Jarvis Rd
- 14442 Gleaming Rose Dr
- 14539 Gleaming Rose Dr
- 14634 Bergenia Dr
- 14103 Sherburn Manor Dr
- 13538 Fawn Lily Dr
- 15923 Hurstfield Pointe Dr
- 13002 Huffmeister Rd
- 13931 Huffmeister Rd
- 13218 Blossomheath Rd
- 13718 Sherburn Manor Dr
- 13926 Wessex Park Dr
- 15922 Clipper Pointe Dr
- 12803 Shady Knoll Ln
- 12826 Rolling Valley Dr
- 14807 Providence Manor Way
- 12726 Shady Knoll Ln
- 12719 Shady Knoll Ln
- 14322 Prosper Ridge Dr
- 14310 Prosper Ridge Dr
- 14326 Prosper Ridge Dr
- 14311 Prosper Ridge Dr
- 14306 Prosper Ridge Dr
- 14330 Prosper Ridge Dr
- 14315 Prosper Ridge Dr
- 14319 Prosper Ridge Dr
- 14323 Prosper Ridge Dr
- 14334 Prosper Ridge Dr
- 14327 Prosper Ridge Dr
- 14302 Prosper Ridge Dr
- 14331 Prosper Ridge Dr
- 14338 Prosper Ridge Dr
- 13314 Mablehurst Dr
- 13303 Mablehurst Dr
- 13307 Mablehurst Dr
- 14335 Prosper Ridge Dr
- 13319 Corrigan Springs Dr
- 13311 Mablehurst Dr