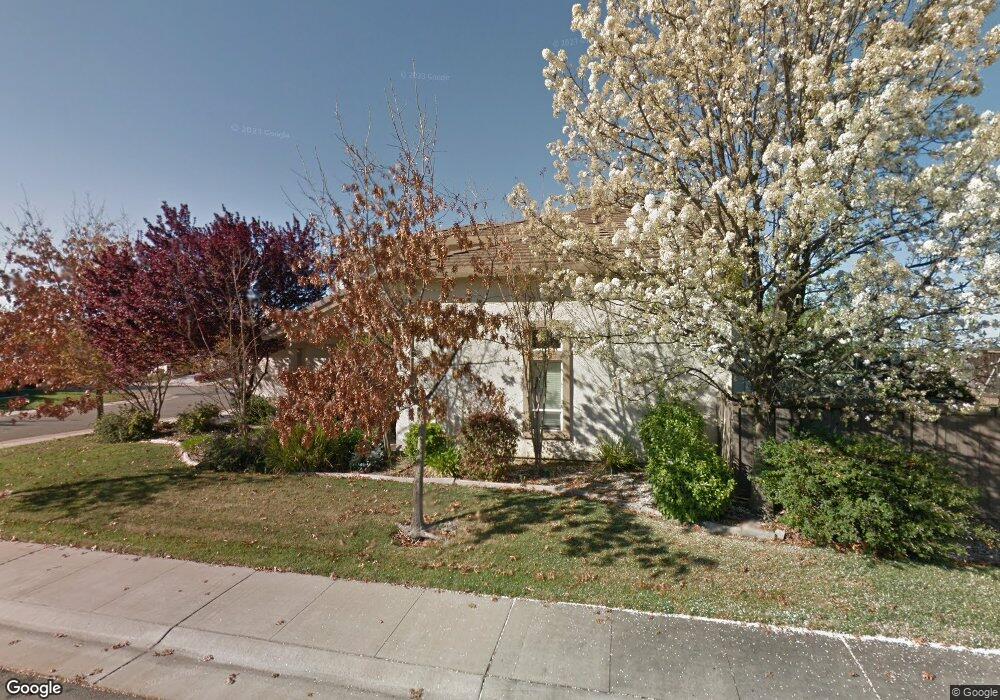
1433 Mayfield St Sacramento, CA 95835
Natomas Park NeighborhoodEstimated Value: $520,000 - $682,000
5
Beds
3
Baths
2,369
Sq Ft
$266/Sq Ft
Est. Value
About This Home
This home is located at 1433 Mayfield St, Sacramento, CA 95835 and is currently estimated at $630,570, approximately $266 per square foot. 1433 Mayfield St is a home located in Sacramento County with nearby schools including Natomas Park Elementary School, Natomas Middle School, and Inderkum High School.
Ownership History
Date
Name
Owned For
Owner Type
Purchase Details
Closed on
Nov 24, 2004
Sold by
Lumaquin Ma Celerina T
Bought by
Lumaquin Don Michael
Current Estimated Value
Home Financials for this Owner
Home Financials are based on the most recent Mortgage that was taken out on this home.
Original Mortgage
$388,800
Outstanding Balance
$193,673
Interest Rate
5.65%
Mortgage Type
New Conventional
Estimated Equity
$436,897
Purchase Details
Closed on
Nov 6, 2000
Sold by
Lennar Renaissance Inc
Bought by
Parsons Erika
Home Financials for this Owner
Home Financials are based on the most recent Mortgage that was taken out on this home.
Original Mortgage
$202,150
Interest Rate
7.88%
Purchase Details
Closed on
Oct 24, 2000
Sold by
Williams Michael John
Bought by
Parsons Erika
Home Financials for this Owner
Home Financials are based on the most recent Mortgage that was taken out on this home.
Original Mortgage
$202,150
Interest Rate
7.88%
Create a Home Valuation Report for This Property
The Home Valuation Report is an in-depth analysis detailing your home's value as well as a comparison with similar homes in the area
Home Values in the Area
Average Home Value in this Area
Purchase History
| Date | Buyer | Sale Price | Title Company |
|---|---|---|---|
| Lumaquin Don Michael | -- | Alliance Title Company | |
| Lumaquin Don Michael | $486,000 | Alliance Title Company | |
| Parsons Erika | $253,000 | North American Title Co | |
| Parsons Erika | -- | North American Title Co |
Source: Public Records
Mortgage History
| Date | Status | Borrower | Loan Amount |
|---|---|---|---|
| Open | Lumaquin Don Michael | $388,800 | |
| Previous Owner | Parsons Erika | $202,150 | |
| Closed | Lumaquin Don Michael | $97,200 |
Source: Public Records
Tax History Compared to Growth
Tax History
| Year | Tax Paid | Tax Assessment Tax Assessment Total Assessment is a certain percentage of the fair market value that is determined by local assessors to be the total taxable value of land and additions on the property. | Land | Improvement |
|---|---|---|---|---|
| 2025 | $12,885 | $677,425 | $195,139 | $482,286 |
| 2024 | $12,885 | $664,143 | $191,313 | $472,830 |
| 2023 | $8,847 | $651,121 | $187,562 | $463,559 |
| 2022 | $8,725 | $638,355 | $183,885 | $454,470 |
| 2021 | $8,190 | $579,708 | $166,992 | $412,716 |
| 2020 | $7,333 | $504,095 | $145,211 | $358,884 |
| 2019 | $7,111 | $484,707 | $139,626 | $345,081 |
| 2018 | $6,799 | $470,591 | $135,560 | $335,031 |
| 2017 | $6,504 | $452,493 | $130,347 | $322,146 |
| 2016 | $6,216 | $418,976 | $120,692 | $298,284 |
| 2015 | $5,879 | $399,025 | $114,945 | $284,080 |
| 2014 | $5,446 | $380,023 | $109,471 | $270,552 |
Source: Public Records
Map
Nearby Homes
- Plan 3506 at Natomas Landing - The Cottages
- Plan 3504 at Natomas Landing - The Cottages
- Plan 3502 at Natomas Landing - The Cottages
- Plan 3505 at Natomas Landing - The Cottages
- Plan 4001 at Natomas Landing - The Chateaus
- Plan 4002 at Natomas Landing - The Chateaus
- Plan 4503 at Natomas Landing - The Bungalows
- Plan 4005 at Natomas Landing - The Chateaus
- Plan 4502 at Natomas Landing - The Bungalows
- Plan 4504 at Natomas Landing - The Bungalows
- Plan 4003 at Natomas Landing - The Chateaus
- 1469 Mayfield St
- 4860 Blackrock Dr
- 1701 Baines Ave
- 1468 Jeannie Way
- 1472 Jeannie Way
- 1476 Jeannie Way
- 1480 Jeannie Way
- 1760 Montara Ave
- 1840 Montara Ave
- 1437 Mayfield St
- 1441 Mayfield St
- 1418 Mayfield St
- 1422 Mayfield St
- 1434 Mayfield St
- 1430 Mayfield St
- 1445 Mayfield St
- 1426 Mayfield St
- 1501 Arrowbrook Ave
- 1449 Mayfield St
- 1511 Arrowbrook Ave
- 3 Tatum Ct Unit 14
- 7 Tatum Ct
- 11 Tatum Ct
- 1500 Edgemore Ave
- 1453 Mayfield St
- 1521 Arrowbrook Ave
- 15 Tatum Ct
- 1510 Edgemore Ave
- 1457 Mayfield St