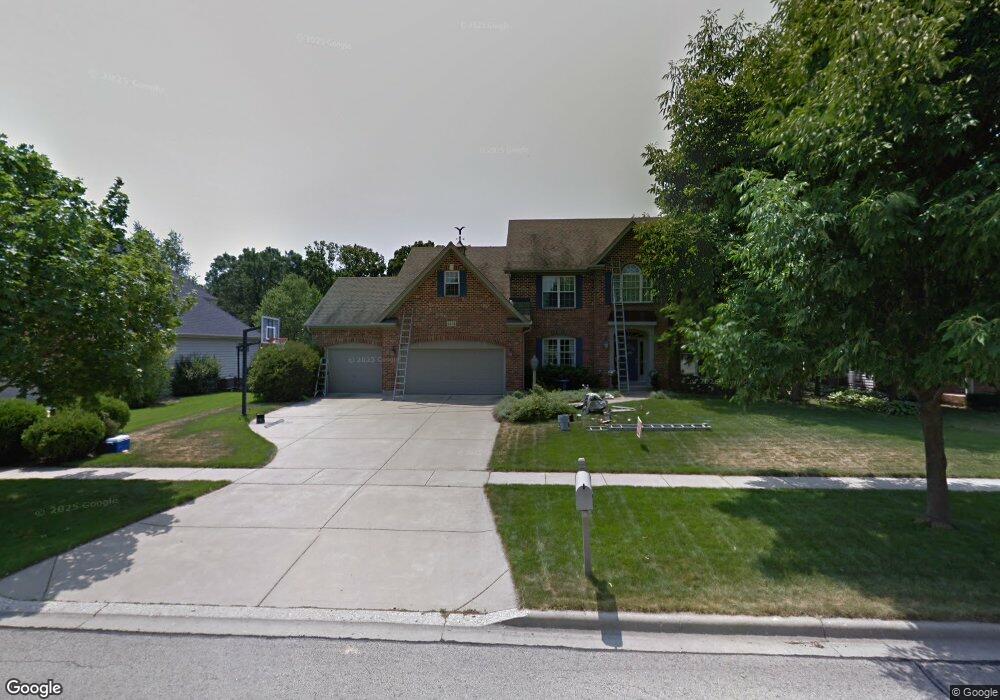
1434 Harvell Dr Batavia, IL 60510
Southwest Batavia NeighborhoodEstimated Value: $744,000 - $794,000
4
Beds
4
Baths
3,754
Sq Ft
$203/Sq Ft
Est. Value
About This Home
This home is located at 1434 Harvell Dr, Batavia, IL 60510 and is currently estimated at $761,319, approximately $202 per square foot. 1434 Harvell Dr is a home located in Kane County with nearby schools including Sam Rotolo Middle School, Batavia Sr High School, and Mooseheart Child City & School.
Ownership History
Date
Name
Owned For
Owner Type
Purchase Details
Closed on
Dec 20, 2017
Sold by
Labarrbera Robert A and Labarrbera Karen A
Bought by
Paulin Robert William and Paulin Rebecca Anne
Current Estimated Value
Home Financials for this Owner
Home Financials are based on the most recent Mortgage that was taken out on this home.
Original Mortgage
$46,000
Outstanding Balance
$38,688
Interest Rate
3.9%
Mortgage Type
Credit Line Revolving
Estimated Equity
$722,631
Purchase Details
Closed on
Oct 27, 1998
Sold by
Harvell Henry
Bought by
Labarbera Robert A and Labarbera Karen A
Home Financials for this Owner
Home Financials are based on the most recent Mortgage that was taken out on this home.
Original Mortgage
$320,000
Interest Rate
6.78%
Purchase Details
Closed on
Jun 15, 1998
Sold by
Harvell Morris H and Harvell Shirley M
Bought by
Harvell Henry
Create a Home Valuation Report for This Property
The Home Valuation Report is an in-depth analysis detailing your home's value as well as a comparison with similar homes in the area
Home Values in the Area
Average Home Value in this Area
Purchase History
| Date | Buyer | Sale Price | Title Company |
|---|---|---|---|
| Paulin Robert William | $460,000 | Chicago Title Insurance Co | |
| Labarbera Robert A | $402,500 | Advanced Title Services Inc | |
| Harvell Henry | -- | -- |
Source: Public Records
Mortgage History
| Date | Status | Borrower | Loan Amount |
|---|---|---|---|
| Open | Paulin Robert William | $46,000 | |
| Previous Owner | Labarbera Robert A | $320,000 |
Source: Public Records
Tax History Compared to Growth
Tax History
| Year | Tax Paid | Tax Assessment Tax Assessment Total Assessment is a certain percentage of the fair market value that is determined by local assessors to be the total taxable value of land and additions on the property. | Land | Improvement |
|---|---|---|---|---|
| 2024 | $15,850 | $208,473 | $51,043 | $157,430 |
| 2023 | $15,550 | $189,211 | $46,327 | $142,884 |
| 2022 | $14,917 | $176,832 | $43,296 | $133,536 |
| 2021 | $14,335 | $167,708 | $41,062 | $126,646 |
| 2020 | $13,987 | $164,484 | $40,273 | $124,211 |
| 2019 | $13,768 | $158,661 | $38,847 | $119,814 |
| 2018 | $13,229 | $152,617 | $37,367 | $115,250 |
| 2017 | $15,478 | $175,652 | $36,135 | $139,517 |
| 2016 | $15,161 | $170,536 | $35,083 | $135,453 |
| 2015 | -- | $166,653 | $34,284 | $132,369 |
| 2014 | -- | $161,407 | $33,205 | $128,202 |
| 2013 | -- | $158,258 | $32,557 | $125,701 |
Source: Public Records
Map
Nearby Homes
- 1375 Green Pheasant Ln
- 344 Danforth Dr
- 369 Danforth Dr
- 384 Danforth Dr
- 396 Danforth Dr
- 303 Danforth Dr
- 41 Weirich Way Unit 77005
- 116 Furnas Dr
- 0000 Sec of Kirk Road and Wind Energy Pass
- 33 Weirich Way Unit 77004
- 125 Furnas Dr
- 143 Furnas Dr
- 119 Furnas Dr
- 131 Furnas Dr
- 218 Weirich Way Unit 88001
- 146 Furnas Dr
- 1316 Brandywine Cir Unit 4
- 818 Bernadette Ln
- 1280 Brandywine Cir
- 1232 S Batavia Ave
- 1414 Harvell Dr Unit V
- 1454 Harvell Dr Unit 5
- 1404 Harvell Dr
- 1474 Harvell Dr
- 1425 Harvell Dr
- 1445 Harvell Dr
- 1465 Harvell Dr
- 1405 Harvell Dr Unit 5
- 1374 Harvell Dr
- 1498 Harvell Dr Unit V
- 1485 Harvell Dr
- 1354 Harvell Dr
- 1230 Donat Ct
- 1365 Harvell Dr
- 1495 Harvell Dr
- 1373 Ken Peddy Ct
- 1224 Donat Ct
- 1229 Donat Ct Unit 6
- 1345 Harvell Dr Unit V
- 1326 Mcclurg Dr