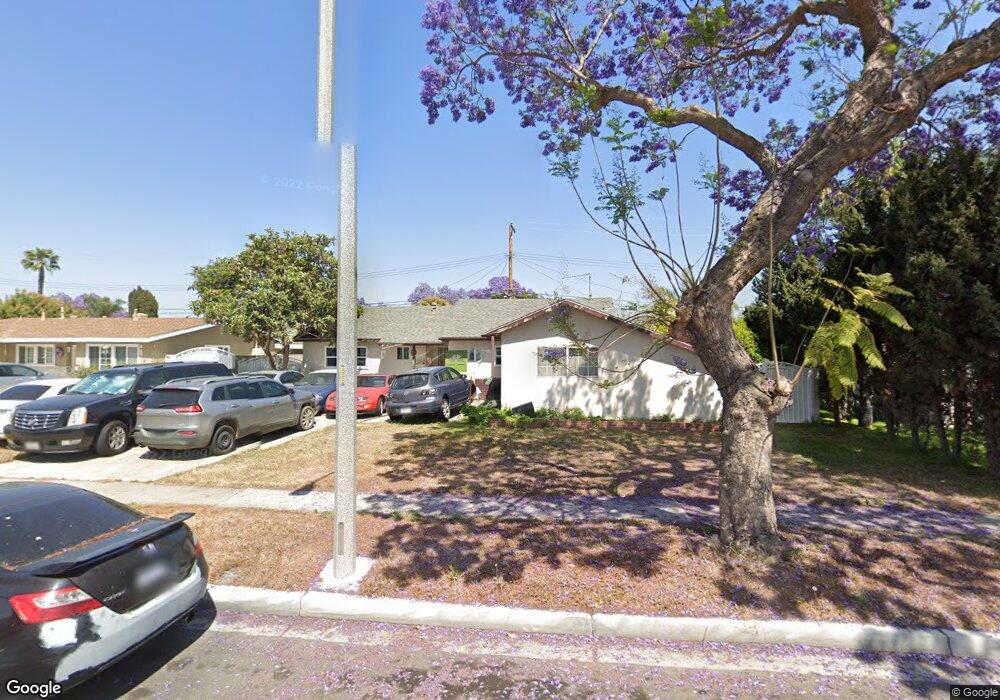
14352 Lake St Garden Grove, CA 92843
Little Saigon NeighborhoodEstimated Value: $928,000 - $987,819
3
Beds
2
Baths
1,322
Sq Ft
$723/Sq Ft
Est. Value
About This Home
This home is located at 14352 Lake St, Garden Grove, CA 92843 and is currently estimated at $956,455, approximately $723 per square foot. 14352 Lake St is a home located in Orange County with nearby schools including Morningside Elementary School, James Irvine Intermediate School, and Bolsa Grande High School.
Ownership History
Date
Name
Owned For
Owner Type
Purchase Details
Closed on
Jun 15, 2004
Sold by
Barrera Felipe H
Bought by
Quisberth Guillermo C
Current Estimated Value
Home Financials for this Owner
Home Financials are based on the most recent Mortgage that was taken out on this home.
Original Mortgage
$207,000
Outstanding Balance
$110,440
Interest Rate
7.5%
Mortgage Type
New Conventional
Estimated Equity
$846,015
Purchase Details
Closed on
May 21, 2004
Sold by
Barrera Gladys and Quisberth Guillermo C
Bought by
Barrera Felipe H
Home Financials for this Owner
Home Financials are based on the most recent Mortgage that was taken out on this home.
Original Mortgage
$207,000
Outstanding Balance
$110,440
Interest Rate
7.5%
Mortgage Type
New Conventional
Estimated Equity
$846,015
Purchase Details
Closed on
Apr 30, 2001
Sold by
Barrera Felipe H and Barrera Gladys
Bought by
Lake Trust #14352
Create a Home Valuation Report for This Property
The Home Valuation Report is an in-depth analysis detailing your home's value as well as a comparison with similar homes in the area
Home Values in the Area
Average Home Value in this Area
Purchase History
| Date | Buyer | Sale Price | Title Company |
|---|---|---|---|
| Quisberth Guillermo C | -- | Old Republic Title Company | |
| Barrera Felipe H | -- | United Title Company La | |
| Lake Trust #14352 | $179,900 | -- |
Source: Public Records
Mortgage History
| Date | Status | Borrower | Loan Amount |
|---|---|---|---|
| Open | Barrera Felipe H | $207,000 |
Source: Public Records
Tax History Compared to Growth
Tax History
| Year | Tax Paid | Tax Assessment Tax Assessment Total Assessment is a certain percentage of the fair market value that is determined by local assessors to be the total taxable value of land and additions on the property. | Land | Improvement |
|---|---|---|---|---|
| 2025 | $5,963 | $479,287 | $396,775 | $82,512 |
| 2024 | $5,963 | $469,890 | $388,995 | $80,895 |
| 2023 | $6,196 | $460,677 | $381,368 | $79,309 |
| 2022 | $6,088 | $451,645 | $373,891 | $77,754 |
| 2021 | $6,024 | $442,790 | $366,560 | $76,230 |
| 2020 | $5,918 | $438,250 | $362,801 | $75,449 |
| 2019 | $5,787 | $429,657 | $355,687 | $73,970 |
| 2018 | $5,669 | $421,233 | $348,713 | $72,520 |
| 2017 | $5,590 | $412,974 | $341,875 | $71,099 |
| 2016 | $5,321 | $404,877 | $335,172 | $69,705 |
| 2015 | $5,250 | $398,796 | $330,138 | $68,658 |
| 2014 | $5,128 | $390,985 | $323,671 | $67,314 |
Source: Public Records
Map
Nearby Homes
- 14356 Taft St
- 14151 Lake St
- 10886 Lotus Dr
- 13322 Euclid St
- 812 N Euclid St
- 5317 Silver Dr
- 14376 Euclid St Unit 1-4
- 5405 W 4th St
- 14171 Flower St
- 10061 15th St
- 9906 13th St
- 323 N Euclid St Unit 99
- 9884 11th St
- 10632 Henderson Ave
- 4832 W 5th St Unit B
- 5132 W 1st St Unit B
- 5112 W 1st St Unit C
- 5114 W 1st St Unit C
- 9936 Pear Dr
- 1609 N Parsons Place
- 14342 Lake St
- 14362 Lake St
- 14351 Pleasant St
- 14361 Pleasant St
- 14341 Pleasant St
- 14322 Lake St
- 14372 Lake St
- 14351 Lake St
- 14361 Lake St
- 14371 Pleasant St
- 14321 Pleasant St
- 14341 Lake St
- 14371 Lake St
- 14312 Lake St
- 14382 Lake St
- 14321 Lake St
- 14381 Lake St
- 14381 Pleasant St
- 14311 Pleasant St
- 14352 Pleasant St