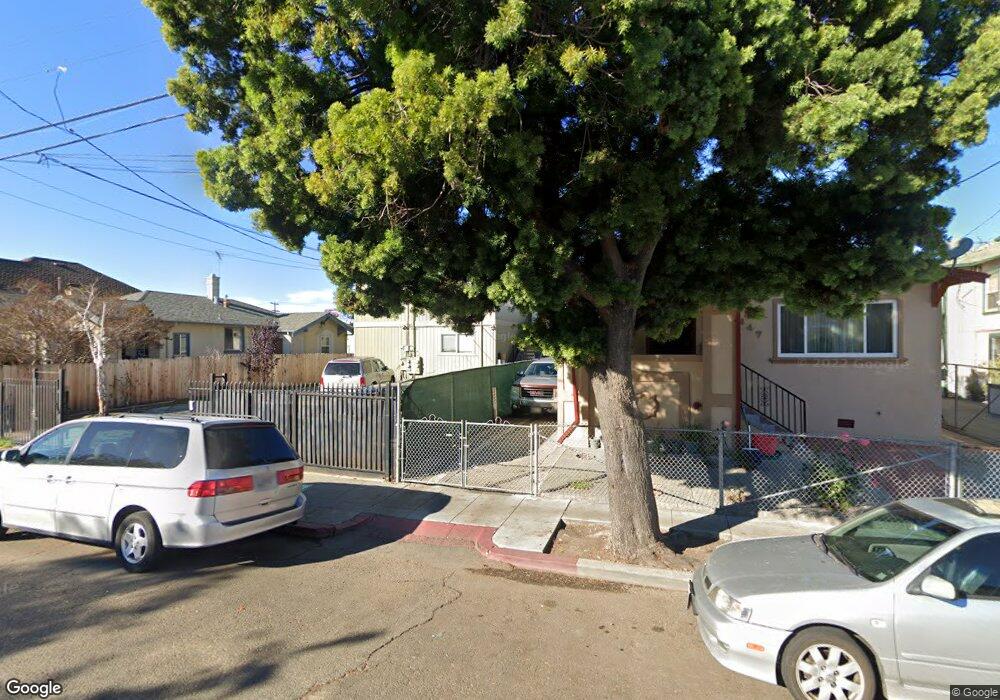
1437 39th Ave Oakland, CA 94601
Fruitvale NeighborhoodEstimated Value: $806,000 - $967,000
12
Beds
6
Baths
4,256
Sq Ft
$211/Sq Ft
Est. Value
About This Home
This home is located at 1437 39th Ave, Oakland, CA 94601 and is currently estimated at $896,333, approximately $210 per square foot. 1437 39th Ave is a home located in Alameda County with nearby schools including Global Family, Urban Promise Academy, and United For Success Academy.
Ownership History
Date
Name
Owned For
Owner Type
Purchase Details
Closed on
May 23, 2023
Sold by
Luo Wei
Bought by
Sun Yi
Current Estimated Value
Home Financials for this Owner
Home Financials are based on the most recent Mortgage that was taken out on this home.
Original Mortgage
$575,000
Outstanding Balance
$559,453
Interest Rate
6.75%
Mortgage Type
New Conventional
Estimated Equity
$336,880
Purchase Details
Closed on
Sep 22, 2011
Sold by
Deutsche Bank National Trust Company
Bought by
Sun Yi
Purchase Details
Closed on
Jul 7, 2011
Sold by
Williams Lucille
Bought by
Deutsche Bank National Trust Company
Purchase Details
Closed on
May 18, 2006
Sold by
Williams Lucille
Bought by
Sailco Inc
Purchase Details
Closed on
Jan 26, 2005
Sold by
Williams Curry
Bought by
Williams Lucille
Home Financials for this Owner
Home Financials are based on the most recent Mortgage that was taken out on this home.
Original Mortgage
$449,495
Interest Rate
5.67%
Mortgage Type
Purchase Money Mortgage
Create a Home Valuation Report for This Property
The Home Valuation Report is an in-depth analysis detailing your home's value as well as a comparison with similar homes in the area
Home Values in the Area
Average Home Value in this Area
Purchase History
| Date | Buyer | Sale Price | Title Company |
|---|---|---|---|
| Sun Yi | -- | Old Republic Title Company | |
| Sun Yi | $272,000 | Lsi Title Company | |
| Deutsche Bank National Trust Company | $229,958 | None Available | |
| Sailco Inc | -- | None Available | |
| Williams Lucille | -- | Fidelity National Title Co | |
| Williams Lucille | $450,454 | Fidelity National Title Co |
Source: Public Records
Mortgage History
| Date | Status | Borrower | Loan Amount |
|---|---|---|---|
| Open | Sun Yi | $575,000 | |
| Previous Owner | Williams Lucille | $449,495 |
Source: Public Records
Tax History Compared to Growth
Tax History
| Year | Tax Paid | Tax Assessment Tax Assessment Total Assessment is a certain percentage of the fair market value that is determined by local assessors to be the total taxable value of land and additions on the property. | Land | Improvement |
|---|---|---|---|---|
| 2025 | $7,729 | $311,998 | $93,822 | $218,176 |
| 2024 | $7,729 | $305,882 | $91,983 | $213,899 |
| 2023 | $7,858 | $299,886 | $90,180 | $209,706 |
| 2022 | $7,362 | $294,005 | $88,411 | $205,594 |
| 2021 | $6,591 | $288,243 | $86,678 | $201,565 |
| 2020 | $6,505 | $285,289 | $85,790 | $199,499 |
| 2019 | $5,969 | $279,698 | $84,109 | $195,589 |
| 2018 | $5,840 | $274,215 | $82,460 | $191,755 |
| 2017 | $5,486 | $268,841 | $80,844 | $187,997 |
| 2016 | $5,259 | $263,568 | $79,258 | $184,310 |
| 2015 | $3,728 | $150,208 | $78,068 | $72,140 |
| 2014 | $5,431 | $255,132 | $76,539 | $178,593 |
Source: Public Records
Map
Nearby Homes
- 1430 38th Ave
- 1439 38th Ave
- 1535 38th Ave
- 1540 37th Ave
- 1631 Rosedale Ave
- 3701 International Blvd
- 4037 E 16th St
- 1501 37th Ave Unit B6
- 1201 41st Ave
- 1818 Rosedale Ave
- 4114 E 17th St
- 4016 E 12th St
- 1464 35th Ave
- 1211 41st Ave
- 1205 41st Ave
- 4010 Foothill Blvd
- 3700 Foothill Blvd
- 3957 Wattling St
- 3314 Farnam St
- 1718 High St