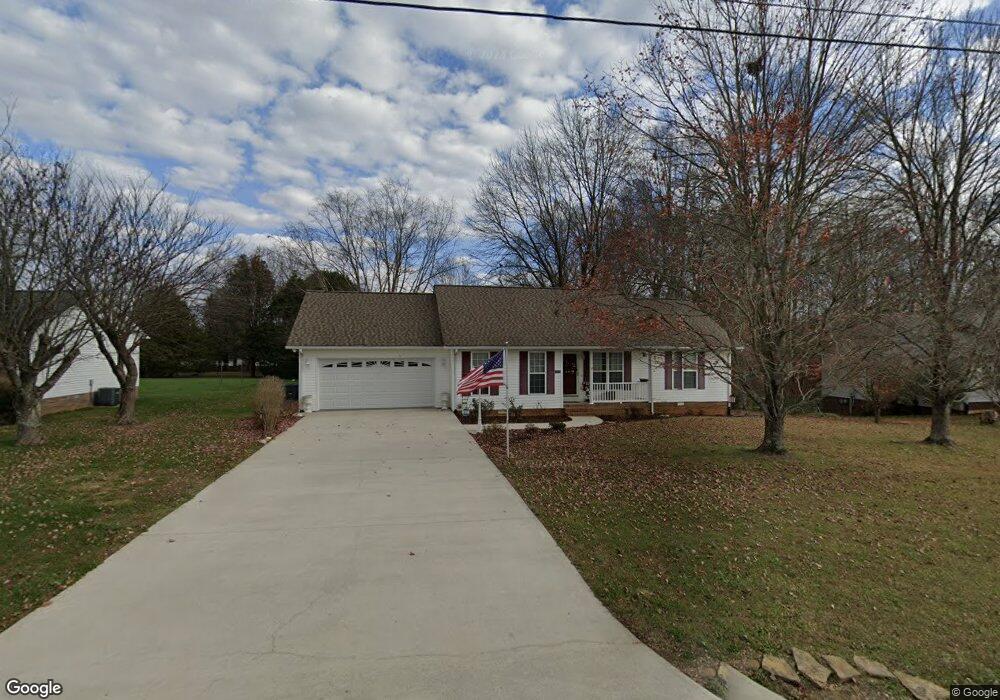
1438 Reeser Ln Cookeville, TN 38501
Estimated Value: $259,907 - $302,000
--
Bed
2
Baths
1,478
Sq Ft
$195/Sq Ft
Est. Value
About This Home
This home is located at 1438 Reeser Ln, Cookeville, TN 38501 and is currently estimated at $287,977, approximately $194 per square foot. 1438 Reeser Ln is a home located in Putnam County with nearby schools including Park View Elementary School, Cookeville High School, and Prescott South Middle School.
Ownership History
Date
Name
Owned For
Owner Type
Purchase Details
Closed on
Sep 1, 2004
Sold by
Rodgers Michael W and Rodgers Katha
Bought by
Ray Teagarden and Ray Carolyn
Current Estimated Value
Home Financials for this Owner
Home Financials are based on the most recent Mortgage that was taken out on this home.
Original Mortgage
$87,000
Outstanding Balance
$43,475
Interest Rate
6.01%
Estimated Equity
$244,502
Purchase Details
Closed on
Jul 29, 2002
Sold by
Greg Baugh
Bought by
Rodgers Michael W and Rodgers Katha
Home Financials for this Owner
Home Financials are based on the most recent Mortgage that was taken out on this home.
Original Mortgage
$100,000
Interest Rate
6.53%
Purchase Details
Closed on
Mar 21, 2002
Bought by
Baugh Greg
Purchase Details
Closed on
Mar 17, 1999
Sold by
Young Donnie C
Bought by
Herb Baugh and Herb Pauletta
Purchase Details
Closed on
Mar 16, 1999
Bought by
Baugh Herb and Baugh Pauletta
Purchase Details
Closed on
Sep 17, 1998
Sold by
Danny Masters
Bought by
Young Donnie C and Young Jean
Create a Home Valuation Report for This Property
The Home Valuation Report is an in-depth analysis detailing your home's value as well as a comparison with similar homes in the area
Home Values in the Area
Average Home Value in this Area
Purchase History
| Date | Buyer | Sale Price | Title Company |
|---|---|---|---|
| Ray Teagarden | $112,000 | -- | |
| Rodgers Michael W | $100,000 | -- | |
| Baugh Greg | $141,000 | -- | |
| Herb Baugh | $28,000 | -- | |
| Baugh Herb | $125,000 | -- | |
| Young Donnie C | $23,000 | -- |
Source: Public Records
Mortgage History
| Date | Status | Borrower | Loan Amount |
|---|---|---|---|
| Open | Young Donnie C | $87,000 | |
| Previous Owner | Young Donnie C | $100,000 |
Source: Public Records
Tax History Compared to Growth
Tax History
| Year | Tax Paid | Tax Assessment Tax Assessment Total Assessment is a certain percentage of the fair market value that is determined by local assessors to be the total taxable value of land and additions on the property. | Land | Improvement |
|---|---|---|---|---|
| 2024 | $1,505 | $42,025 | $4,250 | $37,775 |
| 2023 | $1,505 | $42,025 | $4,250 | $37,775 |
| 2022 | $1,384 | $42,025 | $4,250 | $37,775 |
| 2021 | $1,383 | $42,025 | $4,250 | $37,775 |
| 2020 | $1,322 | $42,025 | $4,250 | $37,775 |
| 2019 | $1,322 | $33,775 | $4,250 | $29,525 |
| 2018 | $1,206 | $33,775 | $4,250 | $29,525 |
| 2017 | $1,206 | $33,775 | $4,250 | $29,525 |
| 2016 | $1,206 | $33,775 | $4,250 | $29,525 |
| 2015 | $1,251 | $33,775 | $4,250 | $29,525 |
| 2014 | $1,224 | $33,027 | $0 | $0 |
Source: Public Records
Map
Nearby Homes
- 1440 Apple Valley Ct
- 1330 Kensington Cir
- 2011 Wildwood Ct
- 1322 Kensington Cir
- 915 Buffalo Valley Rd
- 2.52 ac W Broad St
- 2911 Grand Ridge Dr
- 2.52 St
- Lot 3 Miller
- 279 Willow Brook Dr
- 359 C Camp Rd
- 0 Corner of W Broad St & Tn Ave Unit RTC2794105
- 798 Buffalo Valley Rd
- 270 Locust Grove Rd
- 2606 Park West Dr
- 715 W Oak Dr
- 1957 W Broad St
- 2136 W Broad St
- 2714 Park Dr W
- 1420 Reeser Ln
- 1456 Reeser Ln
- 2147 Jean Ct
- 2105 Jean Ct
- 2111 Jean Ct
- 2141 Jean Ct
- 2104 Jean Ct
- 2160 Jean Ct
- 2110 Jean Ct
- 2142 Jean Ct
- 1328 Reeser Ln
- 2150 Jean Ct
- 2116 Jean Ct
- 2156 Jean Ct
- 2136 Jean Ct
- 2124 Jean Ct
- 2190 Buffalo Valley Rd
- 2198 Buffalo Valley Rd
- 2172 Buffalo Valley Rd
- 2154 Buffalo Valley Rd