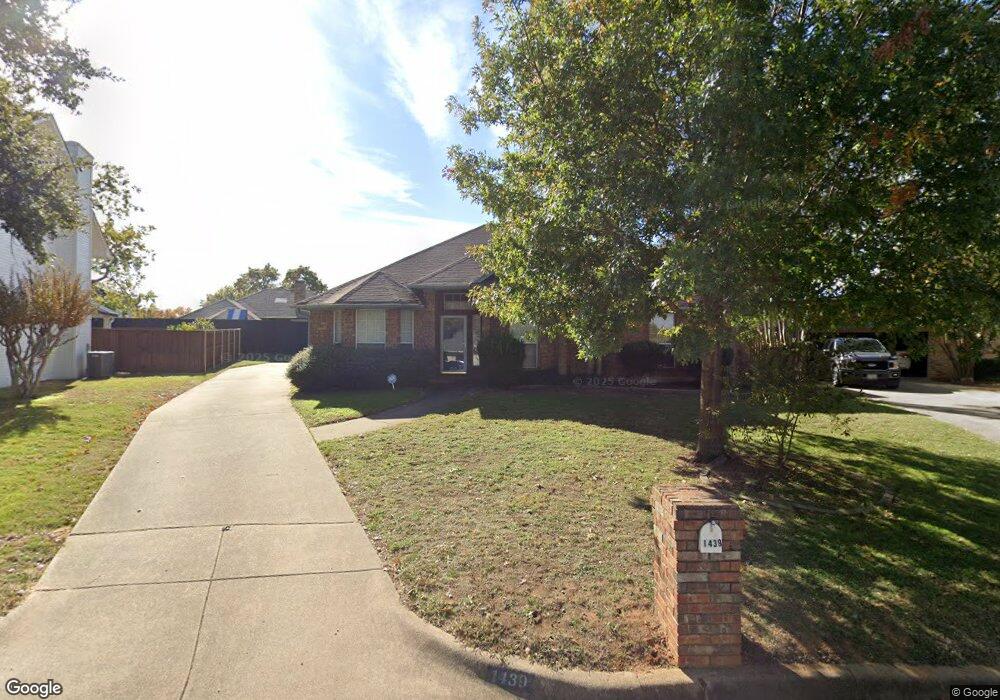
1439 Flamingo Cir Southlake, TX 76092
Estimated Value: $580,960 - $676,000
3
Beds
2
Baths
1,659
Sq Ft
$370/Sq Ft
Est. Value
About This Home
This home is located at 1439 Flamingo Cir, Southlake, TX 76092 and is currently estimated at $614,490, approximately $370 per square foot. 1439 Flamingo Cir is a home located in Tarrant County with nearby schools including Jack D. Johnson Elementary, Don T. Durham Intermediate School, and Carroll Middle School.
Ownership History
Date
Name
Owned For
Owner Type
Purchase Details
Closed on
Apr 10, 2025
Sold by
Mcdonald Beverly B
Bought by
Beverly B Mcdonald Living Trust and Mcdonald
Current Estimated Value
Purchase Details
Closed on
Jan 26, 2022
Sold by
Mcdonald Gary R
Bought by
Mcdonald Beverly B
Purchase Details
Closed on
Jul 16, 2002
Sold by
Niemirowski Adam Frank and Niemirowski Cheryl Jayne
Bought by
Mcdonald Gary R and Mcdonald Beverly B
Home Financials for this Owner
Home Financials are based on the most recent Mortgage that was taken out on this home.
Original Mortgage
$129,600
Interest Rate
6.69%
Purchase Details
Closed on
Mar 23, 2001
Sold by
Niemirowski Adam Frank and Niemirowski Cheryl Jayne
Bought by
Niemirowski Adam Frank and Niemirowski Cheryl Jane
Create a Home Valuation Report for This Property
The Home Valuation Report is an in-depth analysis detailing your home's value as well as a comparison with similar homes in the area
Home Values in the Area
Average Home Value in this Area
Purchase History
| Date | Buyer | Sale Price | Title Company |
|---|---|---|---|
| Beverly B Mcdonald Living Trust | -- | None Listed On Document | |
| Mcdonald Beverly B | -- | None Listed On Document | |
| Mcdonald Gary R | -- | -- | |
| Niemirowski Adam Frank | -- | -- |
Source: Public Records
Mortgage History
| Date | Status | Borrower | Loan Amount |
|---|---|---|---|
| Previous Owner | Mcdonald Gary R | $129,600 |
Source: Public Records
Tax History Compared to Growth
Tax History
| Year | Tax Paid | Tax Assessment Tax Assessment Total Assessment is a certain percentage of the fair market value that is determined by local assessors to be the total taxable value of land and additions on the property. | Land | Improvement |
|---|---|---|---|---|
| 2025 | $1,511 | $507,238 | $174,750 | $332,488 |
| 2024 | $1,511 | $507,238 | $174,750 | $332,488 |
| 2023 | $8,416 | $523,492 | $174,750 | $348,742 |
| 2022 | $9,056 | $422,513 | $116,500 | $306,013 |
| 2021 | $8,700 | $382,275 | $116,500 | $265,775 |
| 2020 | $7,974 | $346,907 | $104,850 | $242,057 |
| 2019 | $7,768 | $345,129 | $85,000 | $260,129 |
| 2018 | $2,734 | $291,622 | $65,000 | $226,622 |
| 2017 | $6,571 | $299,377 | $65,000 | $234,377 |
| 2016 | $5,974 | $279,719 | $65,000 | $214,719 |
| 2015 | $2,712 | $219,100 | $22,000 | $197,100 |
| 2014 | $2,712 | $219,100 | $22,000 | $197,100 |
Source: Public Records
Map
Nearby Homes
- 1340 Burney Ln
- 1099 Burney Ln
- 2920 Burney Ln
- 3055 Midway Rd
- 3321 Ferguson Rd
- 1006 Quail Run Rd
- 3501 N Gravel Cir
- 3325 Ferguson Rd
- 3316 Ferguson Rd
- 3405 Witt Ct
- 1018 Quail Run Rd
- 3179 Southlake Park Rd
- 1497 E Dove Rd
- 3333 Southlake Park Rd
- 1013 Winfield Ct
- 3240 Woodland Dr
- 1920 Fox Hollow Cir
- 136 Sweet St
- 2900 W Kimball Ave
- 415 Marshall Rd
- 1459 Flamingo Cir
- 1419 Flamingo Cir
- 1322 White Wing Ct
- 1302 White Wing Ct
- 1479 Flamingo Cir
- 1399 Flamingo Cir
- 1499 Flamingo Cir
- 1300 White Wing Ct
- 1362 White Wing Ct
- 1542 Flamingo Cir
- 1542 Flamingo Cir
- 1522 Flamingo Cir
- 1319 White Wing Ct
- 1379 Flamingo Cir
- 1519 Flamingo Cir
- 1309 White Wing Ct
- 1339 White Wing Ct
- 1115 Harbor Retreat St
- 1382 White Wing Ct
- 1502 Flamingo Cir