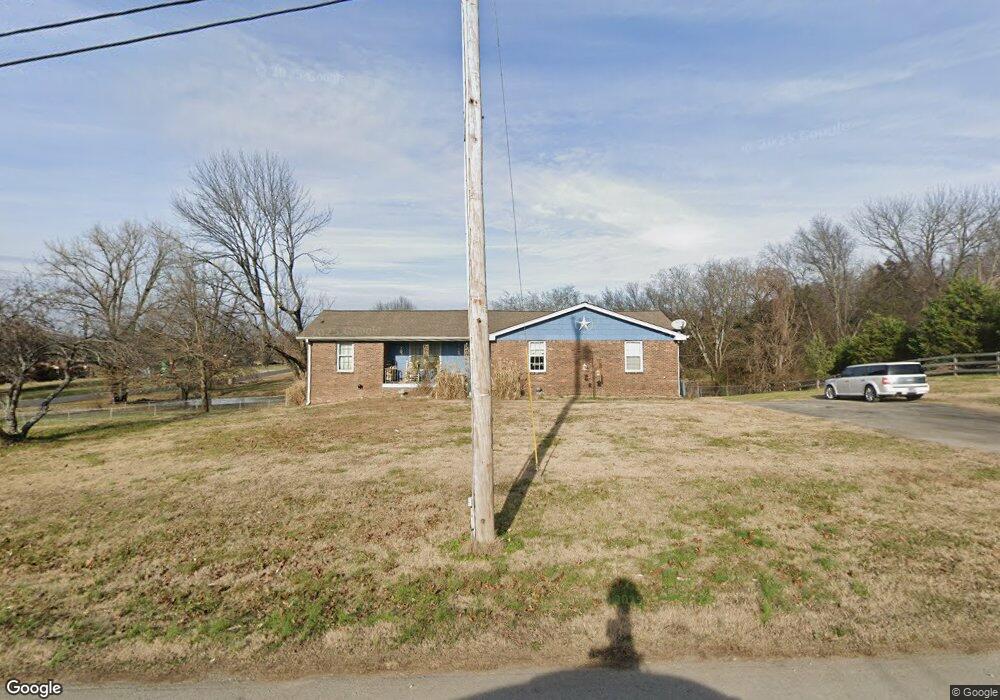
1439 NW Rutland Rd Mount Juliet, TN 37122
Estimated Value: $338,948 - $513,000
--
Bed
2
Baths
1,517
Sq Ft
$280/Sq Ft
Est. Value
About This Home
This home is located at 1439 NW Rutland Rd, Mount Juliet, TN 37122 and is currently estimated at $424,487, approximately $279 per square foot. 1439 NW Rutland Rd is a home located in Wilson County with nearby schools including Stoner Creek Elementary School, West Wilson Middle School, and Mt. Juliet High School.
Ownership History
Date
Name
Owned For
Owner Type
Purchase Details
Closed on
Jan 31, 2022
Sold by
Wooten Angela R
Bought by
Wooten Angela R and Sisco Tracy
Current Estimated Value
Home Financials for this Owner
Home Financials are based on the most recent Mortgage that was taken out on this home.
Original Mortgage
$193,415
Outstanding Balance
$175,066
Interest Rate
3.56%
Mortgage Type
FHA
Estimated Equity
$249,421
Purchase Details
Closed on
Jul 17, 2007
Sold by
Dorris Thomas W
Bought by
Wooten Angela R
Home Financials for this Owner
Home Financials are based on the most recent Mortgage that was taken out on this home.
Original Mortgage
$167,850
Interest Rate
6.65%
Purchase Details
Closed on
Sep 28, 1995
Bought by
Dorris Thomas W
Purchase Details
Closed on
Apr 23, 1992
Bought by
Frazier James R
Purchase Details
Closed on
Jun 6, 1978
Bought by
Gregory Donald W and Gregory Sandra
Create a Home Valuation Report for This Property
The Home Valuation Report is an in-depth analysis detailing your home's value as well as a comparison with similar homes in the area
Home Values in the Area
Average Home Value in this Area
Purchase History
| Date | Buyer | Sale Price | Title Company |
|---|---|---|---|
| Wooten Angela R | -- | Rosenberg Jay A | |
| Wooten Angela R | $167,850 | -- | |
| Dorris Thomas W | $120,000 | -- | |
| Frazier James R | $97,400 | -- | |
| Gregory Donald W | -- | -- |
Source: Public Records
Mortgage History
| Date | Status | Borrower | Loan Amount |
|---|---|---|---|
| Open | Wooten Angela R | $193,415 | |
| Previous Owner | Gregory Donald W | $167,850 |
Source: Public Records
Tax History Compared to Growth
Tax History
| Year | Tax Paid | Tax Assessment Tax Assessment Total Assessment is a certain percentage of the fair market value that is determined by local assessors to be the total taxable value of land and additions on the property. | Land | Improvement |
|---|---|---|---|---|
| 2024 | $1,285 | $67,300 | $23,525 | $43,775 |
| 2022 | $1,278 | $66,925 | $23,525 | $43,400 |
| 2021 | $1,278 | $66,925 | $23,525 | $43,400 |
| 2020 | $1,026 | $66,925 | $23,525 | $43,400 |
| 2019 | $1,026 | $40,750 | $15,500 | $25,250 |
| 2018 | $1,026 | $40,750 | $15,500 | $25,250 |
| 2017 | $1,026 | $40,750 | $15,500 | $25,250 |
| 2016 | $1,026 | $40,750 | $15,500 | $25,250 |
| 2015 | $1,047 | $40,750 | $15,500 | $25,250 |
| 2014 | $1,039 | $40,403 | $0 | $0 |
Source: Public Records
Map
Nearby Homes
- Finley Plan at Bradshaw Farms - Cottages
- Amberbrook Plan at Bradshaw Farms - Cottages
- Harrison Plan at Bradshaw Farms - Cottages
- 112 Crosby Dr
- Chadwick Plan at Bradshaw Farms - Cottages
- 537 Millwood Ln
- 532 Millwood Ln
- 431 Waterbrook Dr
- 282 Killian Way
- 272 Killian Way
- 268 Killian Way
- 3294 Camden Ct
- 2116 Putnam Ln
- 220 Old Towne Dr
- 602 Brigadier St
- 2019 Hidden Cove Rd
- 342 Sunrise Cir
- 609 Heritage Dr
- 120 Southern Way Blvd
- 4600 Boxcroft Cir
- 1436 NW Rutland Rd
- 502 Hunting Hills Dr
- 1544 NW Rutland Rd
- 1365 NW Rutland Rd
- 1380 NW Rutland Rd
- 1476 NW Rutland Rd
- 503 Hunting Hills Dr
- 1340 NW Rutland Rd
- 506 Hunting Hills Dr
- 1528 NW Rutland Rd
- 1508 NW Rutland Rd
- 1323 NW Rutland Rd
- 1316 NW Rutland Rd
- 2 Lot 2a Lebanon Rd
- 0 Due Dr W Unit 1651121
- 111 112 Jones Ln
- 0 Hwy 70 Unit 1473400
- 194 Bench Lane #194
- 4125 N Mount Julious Rd
- 110 Alvin Sperry Pass #110