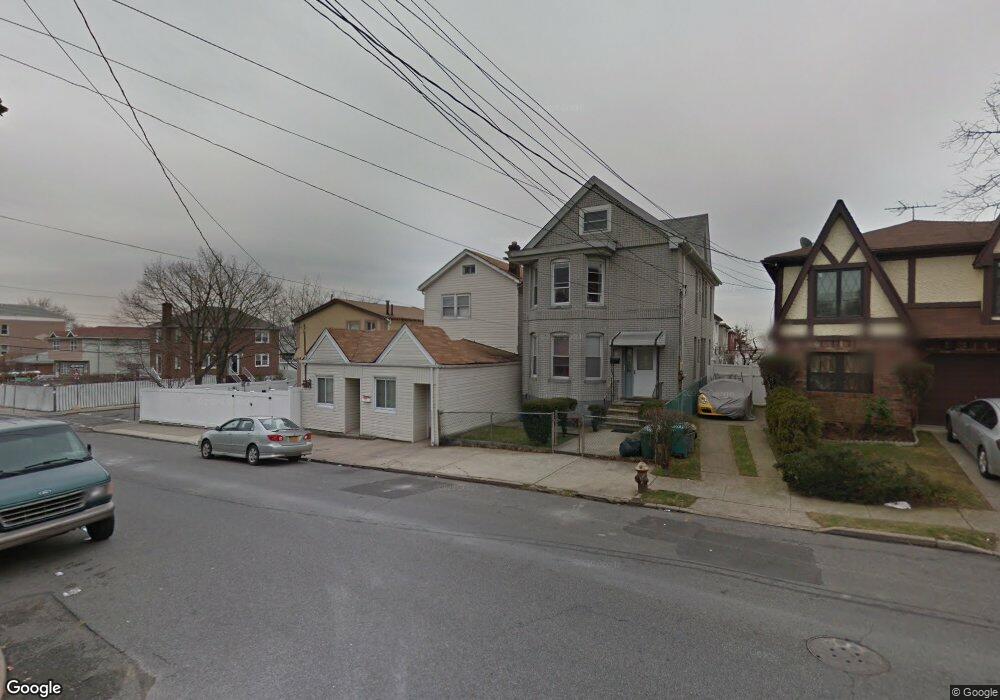
144 Cedar Ave Staten Island, NY 10305
South Beach NeighborhoodEstimated Value: $637,856 - $761,000
2
Beds
2
Baths
1,350
Sq Ft
$524/Sq Ft
Est. Value
About This Home
This home is located at 144 Cedar Ave, Staten Island, NY 10305 and is currently estimated at $706,964, approximately $523 per square foot. 144 Cedar Ave is a home located in Richmond County with nearby schools including P.S. 39 The Francis J. Murphy Jr. School, I.S. 49 Berta A Dreyfus, and Curtis High School.
Ownership History
Date
Name
Owned For
Owner Type
Purchase Details
Closed on
Apr 14, 2011
Sold by
Schroeder Eugene M and Schroeder Premises Trust
Bought by
Zeng Edward and Mei Priscilla P
Current Estimated Value
Home Financials for this Owner
Home Financials are based on the most recent Mortgage that was taken out on this home.
Original Mortgage
$138,750
Interest Rate
4.85%
Mortgage Type
New Conventional
Purchase Details
Closed on
Jan 10, 2005
Sold by
Schroeder Eugene M and Schroeder Edith
Bought by
Schroeder Eugene M
Create a Home Valuation Report for This Property
The Home Valuation Report is an in-depth analysis detailing your home's value as well as a comparison with similar homes in the area
Home Values in the Area
Average Home Value in this Area
Purchase History
| Date | Buyer | Sale Price | Title Company |
|---|---|---|---|
| Zeng Edward | $185,000 | First Amer Title Ins Co Ny | |
| Schroeder Eugene M | -- | Commonwealth Title |
Source: Public Records
Mortgage History
| Date | Status | Borrower | Loan Amount |
|---|---|---|---|
| Previous Owner | Zeng Edward | $138,750 |
Source: Public Records
Tax History Compared to Growth
Tax History
| Year | Tax Paid | Tax Assessment Tax Assessment Total Assessment is a certain percentage of the fair market value that is determined by local assessors to be the total taxable value of land and additions on the property. | Land | Improvement |
|---|---|---|---|---|
| 2025 | $4,920 | $42,420 | $5,399 | $37,021 |
| 2024 | $4,920 | $38,580 | $5,601 | $32,979 |
| 2023 | $4,694 | $23,112 | $5,672 | $17,440 |
| 2022 | $4,614 | $29,220 | $8,820 | $20,400 |
| 2021 | $4,709 | $29,220 | $8,820 | $20,400 |
| 2020 | $4,581 | $29,220 | $8,820 | $20,400 |
| 2019 | $4,271 | $25,380 | $8,820 | $16,560 |
| 2018 | $3,926 | $19,260 | $8,820 | $10,440 |
| 2017 | $4,029 | $19,765 | $8,184 | $11,581 |
| 2016 | $3,728 | $18,648 | $6,768 | $11,880 |
| 2015 | $3,369 | $18,385 | $6,243 | $12,142 |
| 2014 | $3,369 | $17,556 | $7,146 | $10,410 |
Source: Public Records
Map
Nearby Homes