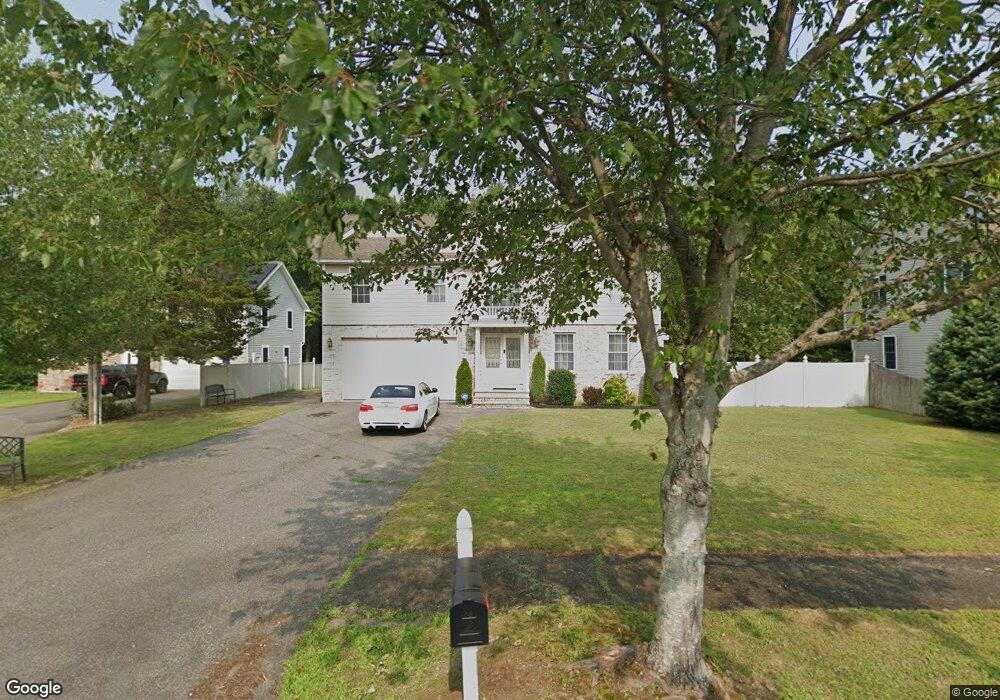
144 King St Ludlow, MA 01056
Estimated Value: $460,885 - $570,000
3
Beds
3
Baths
2,000
Sq Ft
$245/Sq Ft
Est. Value
About This Home
This home is located at 144 King St, Ludlow, MA 01056 and is currently estimated at $490,971, approximately $245 per square foot. 144 King St is a home located in Hampden County with nearby schools including East Street Elementary School, Chapin Street Elementary School, and Paul R. Baird Middle School.
Ownership History
Date
Name
Owned For
Owner Type
Purchase Details
Closed on
Aug 1, 2007
Sold by
Vilkhovoy Nelia and Vilkhovoy V
Bought by
Tran Nhan V and Cao Thuy N
Current Estimated Value
Home Financials for this Owner
Home Financials are based on the most recent Mortgage that was taken out on this home.
Original Mortgage
$100,000
Outstanding Balance
$62,958
Interest Rate
6.73%
Mortgage Type
Purchase Money Mortgage
Estimated Equity
$428,013
Create a Home Valuation Report for This Property
The Home Valuation Report is an in-depth analysis detailing your home's value as well as a comparison with similar homes in the area
Home Values in the Area
Average Home Value in this Area
Purchase History
| Date | Buyer | Sale Price | Title Company |
|---|---|---|---|
| Tran Nhan V | $315,000 | -- | |
| Tran Nhan V | $315,000 | -- |
Source: Public Records
Mortgage History
| Date | Status | Borrower | Loan Amount |
|---|---|---|---|
| Open | Tran Nhan V | $100,000 | |
| Closed | Tran Nhan V | $100,000 |
Source: Public Records
Tax History Compared to Growth
Tax History
| Year | Tax Paid | Tax Assessment Tax Assessment Total Assessment is a certain percentage of the fair market value that is determined by local assessors to be the total taxable value of land and additions on the property. | Land | Improvement |
|---|---|---|---|---|
| 2025 | $6,947 | $400,400 | $89,000 | $311,400 |
| 2024 | $6,679 | $369,200 | $89,100 | $280,100 |
| 2023 | $6,473 | $331,800 | $78,200 | $253,600 |
| 2022 | $6,151 | $307,700 | $78,200 | $229,500 |
| 2021 | $6,174 | $292,900 | $78,200 | $214,700 |
| 2020 | $5,959 | $289,000 | $77,000 | $212,000 |
| 2019 | $5,645 | $284,800 | $76,300 | $208,500 |
| 2018 | $5,308 | $279,200 | $76,300 | $202,900 |
| 2017 | $5,151 | $278,000 | $74,700 | $203,300 |
| 2016 | $5,107 | $281,700 | $73,200 | $208,500 |
| 2015 | $4,827 | $279,200 | $72,500 | $206,700 |
Source: Public Records
Map
Nearby Homes