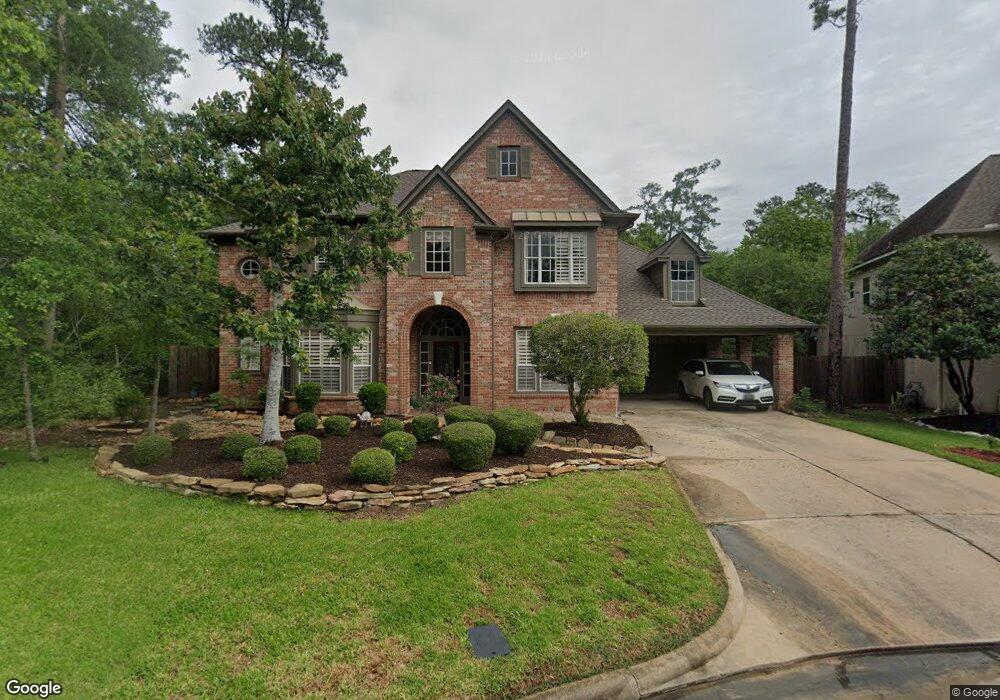
14414 Vanover Ln Cypress, TX 77429
Estimated Value: $542,834 - $647,000
4
Beds
4
Baths
3,626
Sq Ft
$166/Sq Ft
Est. Value
About This Home
This home is located at 14414 Vanover Ln, Cypress, TX 77429 and is currently estimated at $600,459, approximately $165 per square foot. 14414 Vanover Ln is a home located in Harris County with nearby schools including Hamilton Elementary School, Hamilton Middle School, and Cy-Fair High School.
Ownership History
Date
Name
Owned For
Owner Type
Purchase Details
Closed on
Jun 26, 2015
Sold by
Mapel Frank B and Mapel Sarron
Bought by
Higgins Peter Ray
Current Estimated Value
Home Financials for this Owner
Home Financials are based on the most recent Mortgage that was taken out on this home.
Original Mortgage
$286,500
Outstanding Balance
$223,785
Interest Rate
3.91%
Mortgage Type
New Conventional
Estimated Equity
$376,674
Purchase Details
Closed on
Oct 23, 1997
Sold by
Houston Village Builders Inc
Bought by
Mapel Frank B and Mapel Sharron
Home Financials for this Owner
Home Financials are based on the most recent Mortgage that was taken out on this home.
Original Mortgage
$244,650
Interest Rate
7.52%
Purchase Details
Closed on
May 16, 1997
Sold by
Pilgrim Louetta Ltd Partnership
Bought by
Houston Village Builders Inc
Create a Home Valuation Report for This Property
The Home Valuation Report is an in-depth analysis detailing your home's value as well as a comparison with similar homes in the area
Home Values in the Area
Average Home Value in this Area
Purchase History
| Date | Buyer | Sale Price | Title Company |
|---|---|---|---|
| Higgins Peter Ray | -- | Charter Title Co | |
| Mapel Frank B | -- | Regency Title | |
| Houston Village Builders Inc | -- | Regency Title |
Source: Public Records
Mortgage History
| Date | Status | Borrower | Loan Amount |
|---|---|---|---|
| Open | Higgins Peter Ray | $286,500 | |
| Previous Owner | Mapel Frank B | $244,650 |
Source: Public Records
Tax History Compared to Growth
Tax History
| Year | Tax Paid | Tax Assessment Tax Assessment Total Assessment is a certain percentage of the fair market value that is determined by local assessors to be the total taxable value of land and additions on the property. | Land | Improvement |
|---|---|---|---|---|
| 2025 | $6,512 | $506,148 | $121,739 | $384,409 |
| 2024 | $6,512 | $533,337 | $158,789 | $374,548 |
| 2023 | $6,512 | $501,253 | $158,789 | $342,464 |
| 2022 | $6,003 | $519,212 | $113,622 | $405,590 |
| 2021 | $10,482 | $415,802 | $113,622 | $302,180 |
| 2020 | $9,735 | $381,887 | $75,513 | $306,374 |
| 2019 | $9,860 | $373,640 | $75,513 | $298,127 |
| 2018 | $3,963 | $375,217 | $75,513 | $299,704 |
| 2017 | $10,073 | $375,217 | $75,513 | $299,704 |
| 2016 | $9,768 | $363,848 | $75,513 | $288,335 |
| 2015 | $5,316 | $359,753 | $75,513 | $284,240 |
| 2014 | $5,316 | $346,946 | $75,513 | $271,433 |
Source: Public Records
Map
Nearby Homes
- 13506 Contado Ct
- 6 Airport Drive Lot # 6
- 13443 Missarah Ln
- 13531 Clareton Ln
- 14822 Kingsford Willow Ln
- 14807 Providence Manor Way
- 14915 Windmill Cove Ln
- 14906 Stonemeade Place
- 12214 Francel Ln
- 14634 Bergenia Dr
- 14539 Gleaming Rose Dr
- 13635 Kluge Corner Ln
- 13810 Lake Port
- 14442 Gleaming Rose Dr
- 13931 Huffmeister Rd
- 15110 Green Tavern Ct
- 12537 Kluge Rd
- 14706 Lindall Ct
- 13710 Casaba Ct
- 13002 Huffmeister Rd
- 14410 Vanover Ln
- 14406 Vanover Ln
- 14406 Traceton Cir
- 14402 Vanover Ln
- 14502 Claycroft Ct
- 14410 Traceton Cir
- 14402 Traceton Cir
- 14506 Claycroft Ct
- 14411 Traceton Cir
- 14510 Claycroft Ct
- 14511 Claycroft Ct
- 14303 Spyglen Ln
- 14307 Spyglen Ln
- 14218 Spyglen Ln
- 14407 Traceton Cir
- 14514 Claycroft Ct
- 14219 Spyglen Ln
- 14515 Claycroft Ct
- 14311 Spyglen Ln
- 14214 Spyglen Ln