14422 Gleaming Rose Dr Cypress, TX 77429
Estimated Value: $471,677 - $537,000
4
Beds
4
Baths
3,224
Sq Ft
$157/Sq Ft
Est. Value
About This Home
This home is located at 14422 Gleaming Rose Dr, Cypress, TX 77429 and is currently estimated at $505,669, approximately $156 per square foot. 14422 Gleaming Rose Dr is a home located in Harris County with nearby schools including Sampson Elementary School, Spillane Middle School, and Cypress Woods High School.
Ownership History
Date
Name
Owned For
Owner Type
Purchase Details
Closed on
Aug 13, 2015
Sold by
Seloover Jim and Seloover Vinessa
Bought by
Norwood Arthur and Norwood Melinda
Current Estimated Value
Home Financials for this Owner
Home Financials are based on the most recent Mortgage that was taken out on this home.
Original Mortgage
$277,950
Outstanding Balance
$219,346
Interest Rate
4.13%
Mortgage Type
New Conventional
Estimated Equity
$286,323
Purchase Details
Closed on
Dec 5, 2008
Sold by
Darling Homes Of Houston Ltd
Bought by
Seloover Jim and Seloover Vinessa
Home Financials for this Owner
Home Financials are based on the most recent Mortgage that was taken out on this home.
Original Mortgage
$209,274
Interest Rate
6.48%
Mortgage Type
Purchase Money Mortgage
Create a Home Valuation Report for This Property
The Home Valuation Report is an in-depth analysis detailing your home's value as well as a comparison with similar homes in the area
Home Values in the Area
Average Home Value in this Area
Purchase History
| Date | Buyer | Sale Price | Title Company |
|---|---|---|---|
| Norwood Arthur | -- | Attorney | |
| Seloover Jim | -- | Multiple |
Source: Public Records
Mortgage History
| Date | Status | Borrower | Loan Amount |
|---|---|---|---|
| Open | Norwood Arthur | $277,950 | |
| Previous Owner | Seloover Jim | $209,274 |
Source: Public Records
Tax History Compared to Growth
Tax History
| Year | Tax Paid | Tax Assessment Tax Assessment Total Assessment is a certain percentage of the fair market value that is determined by local assessors to be the total taxable value of land and additions on the property. | Land | Improvement |
|---|---|---|---|---|
| 2025 | $10,551 | $477,118 | $77,735 | $399,383 |
| 2024 | $10,551 | $480,003 | $70,759 | $409,244 |
| 2023 | $10,551 | $480,003 | $70,759 | $409,244 |
| 2022 | $10,003 | $419,752 | $56,474 | $363,278 |
| 2021 | $8,537 | $337,298 | $56,474 | $280,824 |
| 2020 | $8,514 | $326,310 | $43,518 | $282,792 |
| 2019 | $8,780 | $326,310 | $43,518 | $282,792 |
| 2018 | $4,533 | $314,801 | $43,518 | $271,283 |
| 2017 | $8,472 | $314,801 | $43,518 | $271,283 |
| 2016 | $8,472 | $314,801 | $43,518 | $271,283 |
| 2015 | $6,107 | $273,841 | $43,518 | $230,323 |
| 2014 | $6,107 | $273,841 | $43,518 | $230,323 |
Source: Public Records
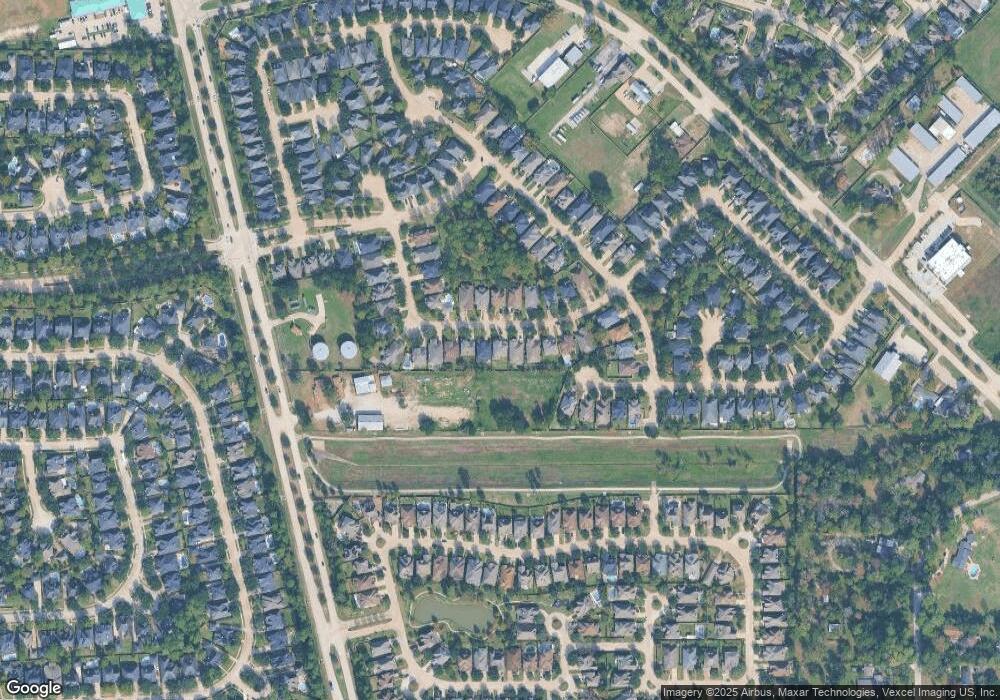
Map
Nearby Homes
- 14442 Gleaming Rose Dr
- 14539 Gleaming Rose Dr
- 13538 Fawn Lily Dr
- 14210 Prospect Point Dr
- 14634 Bergenia Dr
- 14314 Prosper Ridge Dr
- 14103 Sherburn Manor Dr
- 13002 Huffmeister Rd
- 13835 Jarvis Rd
- 15923 Hurstfield Pointe Dr
- 13926 Wessex Park Dr
- 14807 Providence Manor Way
- 15922 Clipper Pointe Dr
- 13931 Huffmeister Rd
- 13531 Clareton Ln
- 6 Airport Drive Lot # 6
- 13718 Sherburn Manor Dr
- 14210 Northface Manor Ct
- 14822 Kingsford Willow Ln
- 13506 Contado Ct
- 14426 Gleaming Rose Dr
- 14418 Gleaming Rose Dr
- 14414 Gleaming Rose Dr
- 14430 Gleaming Rose Dr
- 14410 Gleaming Rose Dr
- 13600 Telge Rd
- 14434 Gleaming Rose Dr
- 14423 Gleaming Rose Dr
- 14427 Gleaming Rose Dr
- 14419 Gleaming Rose Dr
- 14431 Gleaming Rose Dr
- 14406 Gleaming Rose Dr
- 14415 Gleaming Rose Dr
- 14438 Gleaming Rose Dr
- 14435 Gleaming Rose Dr
- 13610 Indigo Spires Dr
- 14402 Gleaming Rose Dr
- 14402 Bergenia Dr
- 14439 Gleaming Rose Dr
- 13614 Indigo Spires Dr