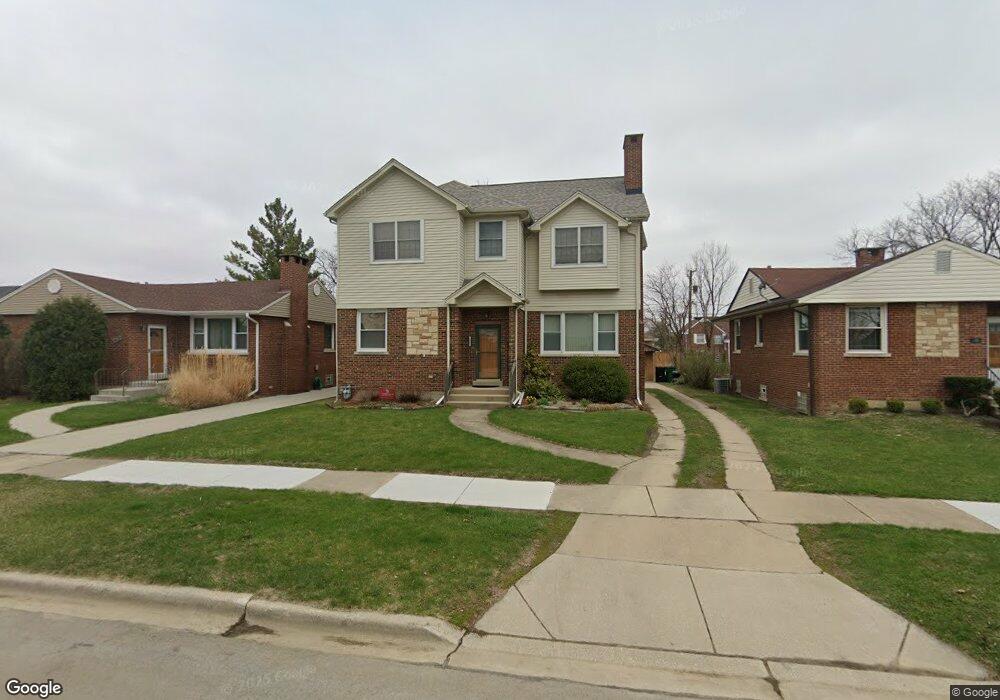
1445 Hull Ave Westchester, IL 60154
Estimated Value: $453,000 - $509,000
--
Bed
3
Baths
2,885
Sq Ft
$169/Sq Ft
Est. Value
About This Home
This home is located at 1445 Hull Ave, Westchester, IL 60154 and is currently estimated at $486,137, approximately $168 per square foot. 1445 Hull Ave is a home located in Cook County with nearby schools including Westchester Primary School, Westchester Intermediate School, and Westchester Middle School.
Ownership History
Date
Name
Owned For
Owner Type
Purchase Details
Closed on
Nov 21, 2014
Sold by
Woodruff Joel A and Woodruff Corie R
Bought by
Woodruff Joel A and Woodruff Corie R
Current Estimated Value
Home Financials for this Owner
Home Financials are based on the most recent Mortgage that was taken out on this home.
Original Mortgage
$301,399
Outstanding Balance
$229,784
Interest Rate
3.95%
Mortgage Type
VA
Estimated Equity
$256,353
Purchase Details
Closed on
Jan 28, 2005
Sold by
Woodruff Joel Allen and Woodruff Corie R
Bought by
Woodruff Joel A and Woodruff Corie R
Purchase Details
Closed on
Nov 30, 1998
Sold by
Zagone John R and Zagone Deborah L
Bought by
Woodruff Joel Allen and Rapinchuk Corie R
Home Financials for this Owner
Home Financials are based on the most recent Mortgage that was taken out on this home.
Original Mortgage
$136,000
Interest Rate
6.8%
Create a Home Valuation Report for This Property
The Home Valuation Report is an in-depth analysis detailing your home's value as well as a comparison with similar homes in the area
Home Values in the Area
Average Home Value in this Area
Purchase History
| Date | Buyer | Sale Price | Title Company |
|---|---|---|---|
| Woodruff Joel A | -- | None Available | |
| Woodruff Joel A | -- | Residential Title Services | |
| Woodruff Joel Allen | $148,000 | -- |
Source: Public Records
Mortgage History
| Date | Status | Borrower | Loan Amount |
|---|---|---|---|
| Open | Woodruff Joel A | $301,399 | |
| Closed | Woodruff Joel Allen | $136,000 |
Source: Public Records
Tax History Compared to Growth
Tax History
| Year | Tax Paid | Tax Assessment Tax Assessment Total Assessment is a certain percentage of the fair market value that is determined by local assessors to be the total taxable value of land and additions on the property. | Land | Improvement |
|---|---|---|---|---|
| 2024 | $9,365 | $39,001 | $4,813 | $34,188 |
| 2023 | $8,385 | $39,001 | $4,813 | $34,188 |
| 2022 | $8,385 | $30,903 | $4,125 | $26,778 |
| 2021 | $8,143 | $30,903 | $4,125 | $26,778 |
| 2020 | $8,021 | $30,903 | $4,125 | $26,778 |
| 2019 | $7,924 | $31,477 | $3,781 | $27,696 |
| 2018 | $7,818 | $31,477 | $3,781 | $27,696 |
| 2017 | $8,038 | $32,769 | $3,781 | $28,988 |
| 2016 | $7,325 | $27,613 | $3,437 | $24,176 |
| 2015 | $7,195 | $27,613 | $3,437 | $24,176 |
| 2014 | $8,436 | $29,996 | $3,437 | $26,559 |
| 2013 | $6,619 | $31,412 | $3,437 | $27,975 |
Source: Public Records
Map
Nearby Homes
- 10072 Drury Ln
- 1500 Bristol Ave
- 1623 Manchester Ave
- 1601 Bristol Ave
- 1247 S Mannheim Rd Unit 3
- 1816 Manchester Ave
- 1907 Suffolk Ave
- 1932 Newcastle Ave
- 1119 Newcastle Ave
- 1900 Manchester Ave
- 10524 Camelot St
- 10531 Camelot St
- 1840 Gardner Rd
- 2128 Hull Ave
- 10567 Waterford Dr
- 920 Suffolk Ave
- 923 Manchester Ave
- 814 Norfolk Ave
- 805 Norfolk Ave
- 1811 Downing Ave
- 1439 Hull Ave
- 1449 Hull Ave
- 1433 Hull Ave
- 10120 Chaucer St
- 10120 Chaucer St
- 1440 Newcastle Ave
- 1440 Newcastle Ave
- 1446 Newcastle Ave
- 1450 Newcastle Ave
- 1427 Hull Ave
- 1434 Newcastle Ave
- 1444 Hull Ave
- 1444 Hull Ave
- 1430 Newcastle Ave
- 1430 Newcastle Ave
- 1456 Newcastle Ave
- 1440 Hull Ave
- 1452 Hull Ave
- 1436 Hull Ave
- 1423 Hull Ave