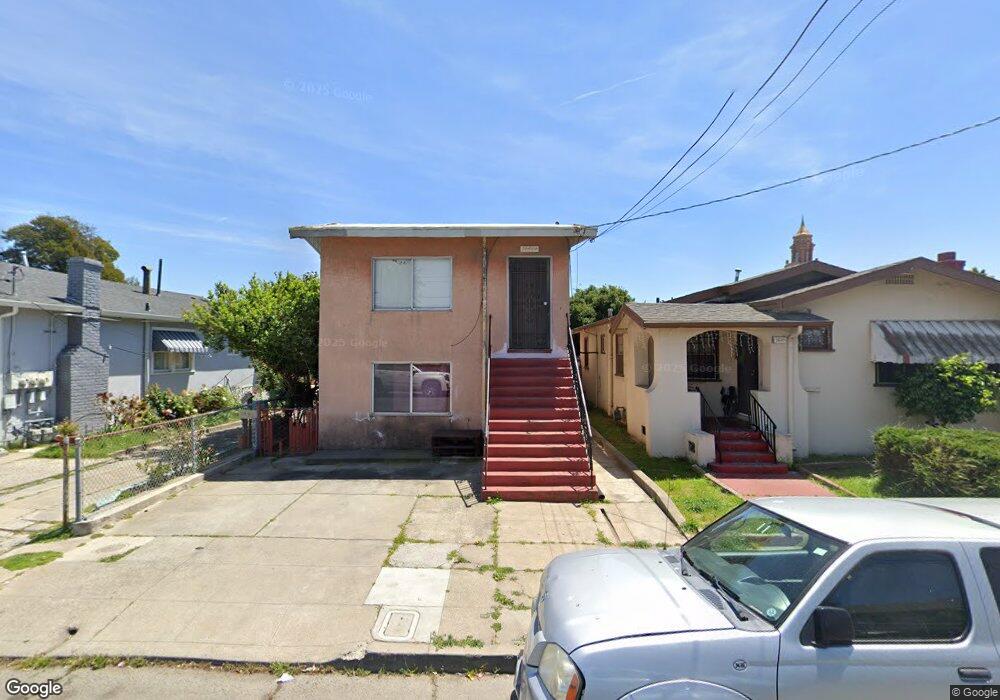
1446 56th Ave Oakland, CA 94621
Seminary NeighborhoodEstimated Value: $528,000 - $610,000
4
Beds
2
Baths
1,728
Sq Ft
$327/Sq Ft
Est. Value
About This Home
This home is located at 1446 56th Ave, Oakland, CA 94621 and is currently estimated at $565,448, approximately $327 per square foot. 1446 56th Ave is a home located in Alameda County with nearby schools including Greenleaf TK-8, Coliseum College Prep Academy, and Fremont High School.
Ownership History
Date
Name
Owned For
Owner Type
Purchase Details
Closed on
May 18, 2015
Sold by
Ahmed Hayat Naser
Bought by
Ismail Musa Saleh
Current Estimated Value
Home Financials for this Owner
Home Financials are based on the most recent Mortgage that was taken out on this home.
Original Mortgage
$172,250
Outstanding Balance
$140,319
Interest Rate
5.37%
Mortgage Type
Adjustable Rate Mortgage/ARM
Estimated Equity
$425,129
Purchase Details
Closed on
Mar 14, 2003
Sold by
Defratus Doris W E and Defratus Adolph E
Bought by
Iniguez Juan M and Iniguez Sandra L
Home Financials for this Owner
Home Financials are based on the most recent Mortgage that was taken out on this home.
Original Mortgage
$247,500
Interest Rate
5.79%
Purchase Details
Closed on
Nov 17, 1999
Sold by
Defratus Adolph E & Doris W Living Trust and Doris W
Bought by
Defratus Doris W E and Defratus Adolph E
Create a Home Valuation Report for This Property
The Home Valuation Report is an in-depth analysis detailing your home's value as well as a comparison with similar homes in the area
Home Values in the Area
Average Home Value in this Area
Purchase History
| Date | Buyer | Sale Price | Title Company |
|---|---|---|---|
| Ismail Musa Saleh | -- | First American Title Company | |
| Ismail Musa Saleh | $265,000 | First American Title Company | |
| Iniguez Juan M | $275,000 | Old Republic Title Company | |
| Defratus Doris W E | -- | -- |
Source: Public Records
Mortgage History
| Date | Status | Borrower | Loan Amount |
|---|---|---|---|
| Open | Ismail Musa Saleh | $172,250 | |
| Previous Owner | Iniguez Juan M | $247,500 |
Source: Public Records
Tax History Compared to Growth
Tax History
| Year | Tax Paid | Tax Assessment Tax Assessment Total Assessment is a certain percentage of the fair market value that is determined by local assessors to be the total taxable value of land and additions on the property. | Land | Improvement |
|---|---|---|---|---|
| 2025 | $6,660 | $318,478 | $95,543 | $222,935 |
| 2024 | $6,660 | $312,235 | $93,670 | $218,565 |
| 2023 | $6,733 | $306,114 | $91,834 | $214,280 |
| 2022 | $6,323 | $300,111 | $90,033 | $210,078 |
| 2021 | $6,013 | $294,228 | $88,268 | $205,960 |
| 2020 | $5,947 | $291,213 | $87,364 | $203,849 |
| 2019 | $5,383 | $285,504 | $85,651 | $199,853 |
| 2018 | $5,274 | $279,908 | $83,972 | $195,936 |
| 2017 | $5,031 | $274,420 | $82,326 | $192,094 |
| 2016 | $4,816 | $269,040 | $80,712 | $188,328 |
| 2015 | $4,720 | $260,000 | $78,000 | $182,000 |
| 2014 | $4,223 | $215,000 | $64,500 | $150,500 |
Source: Public Records
Map
Nearby Homes
- 1605 57th Ave
- 1424 57th Ave
- 5715 E 16th St
- 1604 57th Ave
- 5540 E 17th St
- 5483 Wadean Place
- 5421 Wentworth Ave
- 5910 International Blvd
- 5914 International Blvd
- 1321 60th Ave
- 1301 60th Ave
- 1244 58th Ave
- 2007 57th Ave
- 1436 52nd Ave
- 5553 Harvey Ave
- 5444 Bancroft Ave
- 5217 Bancroft Ave
- 1830 Vicksburg Ave
- 6121 Holway St
- 1163 60th Ave