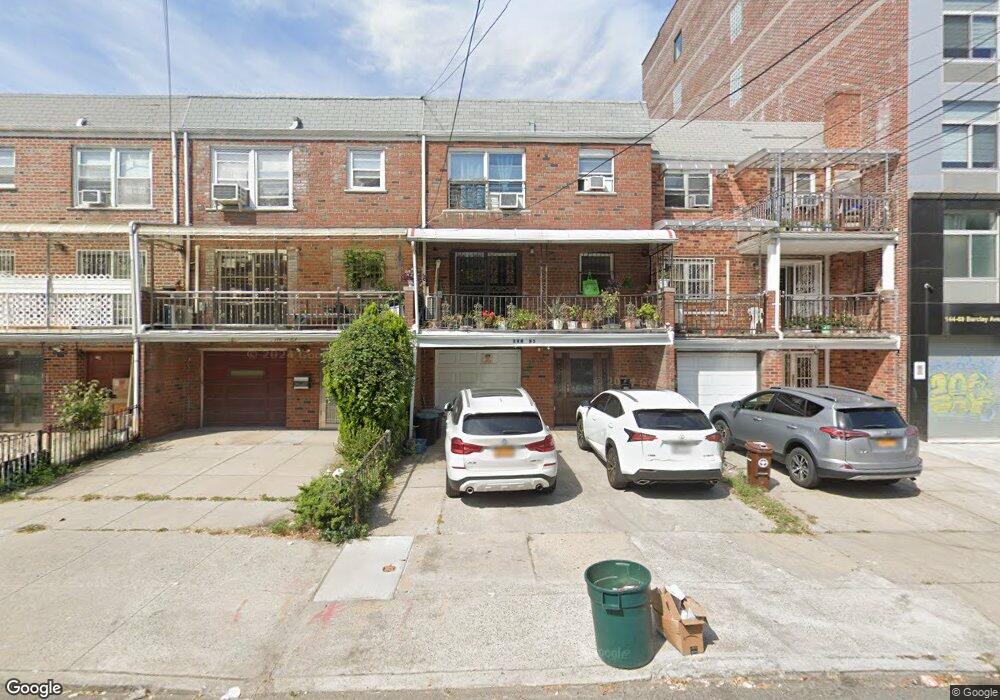
14465 Barclay Ave Flushing, NY 11355
Flushing NeighborhoodEstimated Value: $1,533,080 - $2,054,000
--
Bed
--
Bath
2,635
Sq Ft
$669/Sq Ft
Est. Value
About This Home
This home is located at 14465 Barclay Ave, Flushing, NY 11355 and is currently estimated at $1,762,770, approximately $668 per square foot. 14465 Barclay Ave is a home located in Queens County with nearby schools including P.S. 22 - Thomas Jefferson, J.H.S. 189Q Daniel Carter Beard, and Flushing High School.
Ownership History
Date
Name
Owned For
Owner Type
Purchase Details
Closed on
Jan 17, 2006
Sold by
Chen Guo Qi and Weng Qiao Feng
Bought by
Li Jian Fei and Qu Xiao Le
Current Estimated Value
Home Financials for this Owner
Home Financials are based on the most recent Mortgage that was taken out on this home.
Original Mortgage
$530,000
Outstanding Balance
$298,605
Interest Rate
6.31%
Mortgage Type
Purchase Money Mortgage
Estimated Equity
$1,464,165
Purchase Details
Closed on
Sep 23, 1997
Sold by
Lee Katy
Bought by
Chen Guo Qi and Weng Qiao Feng
Home Financials for this Owner
Home Financials are based on the most recent Mortgage that was taken out on this home.
Original Mortgage
$196,200
Interest Rate
7.31%
Purchase Details
Closed on
Jun 7, 1995
Sold by
Lee Thomas S and Lee Katy
Bought by
Lee Katy
Create a Home Valuation Report for This Property
The Home Valuation Report is an in-depth analysis detailing your home's value as well as a comparison with similar homes in the area
Home Values in the Area
Average Home Value in this Area
Purchase History
| Date | Buyer | Sale Price | Title Company |
|---|---|---|---|
| Li Jian Fei | $890,000 | -- | |
| Li Jian Fei | $890,000 | -- | |
| Chen Guo Qi | $327,000 | Chicago Title Insurance Co | |
| Chen Guo Qi | $327,000 | Chicago Title Insurance Co | |
| Lee Katy | -- | Chicago Title Insurance Co | |
| Lee Katy | -- | Chicago Title Insurance Co |
Source: Public Records
Mortgage History
| Date | Status | Borrower | Loan Amount |
|---|---|---|---|
| Open | Li Jian Fei | $530,000 | |
| Closed | Li Jian Fei | $530,000 | |
| Previous Owner | Chen Guo Qi | $196,200 |
Source: Public Records
Tax History Compared to Growth
Tax History
| Year | Tax Paid | Tax Assessment Tax Assessment Total Assessment is a certain percentage of the fair market value that is determined by local assessors to be the total taxable value of land and additions on the property. | Land | Improvement |
|---|---|---|---|---|
| 2025 | $12,297 | $66,380 | $16,152 | $50,228 |
| 2024 | $12,309 | $62,623 | $16,654 | $45,969 |
| 2023 | $11,585 | $59,080 | $16,244 | $42,836 |
| 2022 | $8,130 | $98,700 | $26,280 | $72,420 |
| 2021 | $11,434 | $87,300 | $26,280 | $61,020 |
| 2020 | $11,413 | $89,820 | $26,280 | $63,540 |
| 2019 | $10,624 | $93,780 | $26,280 | $67,500 |
| 2018 | $9,739 | $49,233 | $11,803 | $37,430 |
| 2017 | $9,169 | $46,448 | $15,273 | $31,175 |
| 2016 | $8,976 | $46,448 | $15,273 | $31,175 |
| 2015 | $5,065 | $46,098 | $19,518 | $26,580 |
| 2014 | $5,065 | $43,489 | $19,123 | $24,366 |
Source: Public Records
Map
Nearby Homes
- 144-69 Barclay Ave Unit 3D
- 144-69 Barclay Ave Unit 6A
- 144-69 Barclay Ave Unit 7C
- 144-70 41st Ave Unit 4D
- 14470 41st Ave Unit 1H/2H
- 144-49 Barclay Ave Unit C1
- 14444 41st Ave Unit 3E
- 144-23 Barclay Ave Unit 6B
- 144-28 Barclay Ave Unit 7B
- 144-80 Sanford Ave Unit 6F
- 144-54 Sanford Ave Unit 38
- 144-27 Sanford Ave Unit 8
- 144-27 Sanford Ave Unit 2
- 144-27 Sanford Ave Unit 6
- 144-27 Sanford Ave Unit 4
- 144-44 Sanford Ave Unit 3
- 144-56 Roosevelt Ave Unit 4B
- 144-30 Sanford Ave Unit 2C
- 144-30 Sanford Ave Unit 6V
- 144-30 Sanford Ave Unit 5
- 14463 Barclay Ave
- 14467 Barclay Ave
- 144-69 Barclay Ave Unit 6D
- 144-69 Barclay Ave Unit C101
- 144-69 Barclay Ave Unit 7 B
- 144-69 Barclay Ave Unit 3 A
- 144-69 Barclay Ave Unit 4 c
- 144-69 Barclay Ave Unit 5 A
- 144-69 Barclay Ave Unit 5 C
- 144-69 Barclay Ave Unit 3 C
- 144-69 Barclay Ave Unit 6 B
- 144-69 Barclay Ave Unit 4B
- 144-69 Barclay Ave Unit 2 B
- 144-69 Barclay Ave Unit 2 A
- 144-69 Barclay Ave Unit 2 D
- 14461 Barclay Ave
- 14469 Barclay Ave
- 14459 Barclay Ave
- 144-57 Barclay Ave
- 14457 Barclay Ave