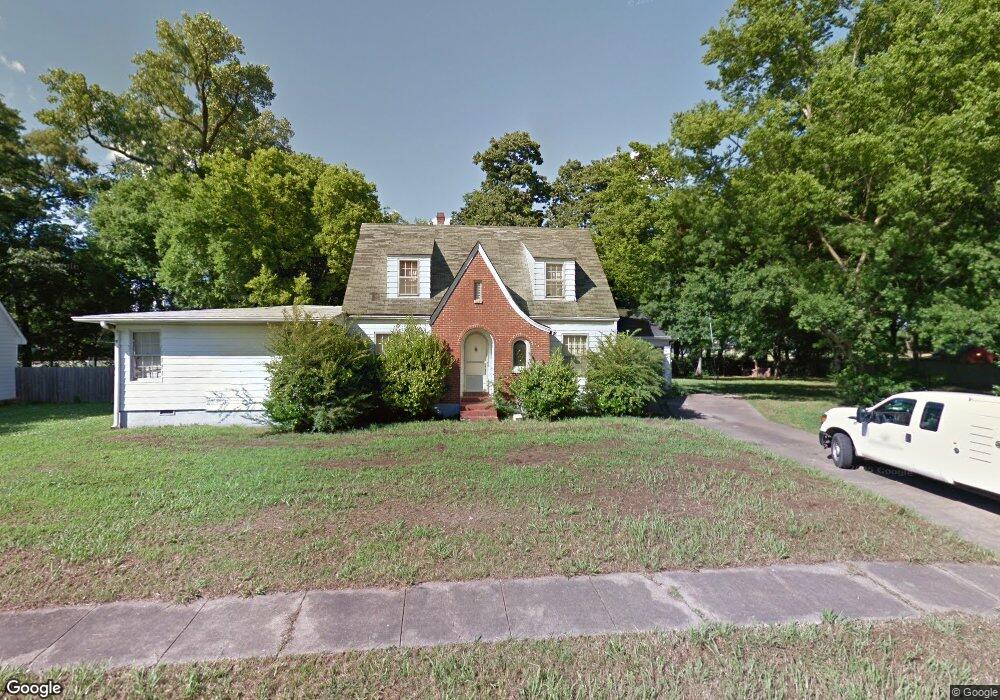
145 Ross Ave West Memphis, AR 72301
Estimated Value: $198,491 - $249,000
4
Beds
3
Baths
2,768
Sq Ft
$77/Sq Ft
Est. Value
About This Home
This home is located at 145 Ross Ave, West Memphis, AR 72301 and is currently estimated at $212,873, approximately $76 per square foot. 145 Ross Ave is a home located in Crittenden County with nearby schools including Bragg Elementary School, West Junior High School, and The Academies of West Memphis Charter School.
Ownership History
Date
Name
Owned For
Owner Type
Purchase Details
Closed on
Jun 6, 2025
Sold by
Hightower Kyle T and England-Hightower Crystal G
Bought by
Mcbroom John Devin
Current Estimated Value
Home Financials for this Owner
Home Financials are based on the most recent Mortgage that was taken out on this home.
Original Mortgage
$201,188
Outstanding Balance
$200,672
Interest Rate
6.81%
Mortgage Type
FHA
Estimated Equity
$12,202
Purchase Details
Closed on
Dec 5, 2022
Sold by
West Bankhead Properties Inc
Bought by
England Crystal G and Hightower Kyle T
Home Financials for this Owner
Home Financials are based on the most recent Mortgage that was taken out on this home.
Original Mortgage
$159,948
Interest Rate
6.95%
Mortgage Type
FHA
Purchase Details
Closed on
Sep 29, 2009
Sold by
Pugh Partnership Lp
Bought by
Higginbotham Hershel O
Purchase Details
Closed on
Nov 1, 2004
Sold by
Not Provided
Bought by
Pugh Partnership Lp
Create a Home Valuation Report for This Property
The Home Valuation Report is an in-depth analysis detailing your home's value as well as a comparison with similar homes in the area
Home Values in the Area
Average Home Value in this Area
Purchase History
| Date | Buyer | Sale Price | Title Company |
|---|---|---|---|
| Mcbroom John Devin | $204,900 | Stewart Title | |
| England Crystal G | $162,900 | Stewart Title | |
| Higginbotham Hershel O | $145,000 | -- | |
| Pugh Partnership Lp | $132,000 | -- |
Source: Public Records
Mortgage History
| Date | Status | Borrower | Loan Amount |
|---|---|---|---|
| Open | Mcbroom John Devin | $201,188 | |
| Closed | Mcbroom John Devin | $11,650 | |
| Previous Owner | England Crystal G | $159,948 | |
| Closed | England Crystal G | $8,000 |
Source: Public Records
Tax History Compared to Growth
Tax History
| Year | Tax Paid | Tax Assessment Tax Assessment Total Assessment is a certain percentage of the fair market value that is determined by local assessors to be the total taxable value of land and additions on the property. | Land | Improvement |
|---|---|---|---|---|
| 2024 | $1,310 | $27,260 | $3,000 | $24,260 |
| 2023 | $1,310 | $27,260 | $3,000 | $24,260 |
| 2022 | $935 | $27,260 | $3,000 | $24,260 |
| 2021 | $935 | $27,260 | $3,000 | $24,260 |
| 2020 | $1,235 | $27,260 | $3,000 | $24,260 |
| 2019 | $1,019 | $26,970 | $1,700 | $25,270 |
| 2018 | $744 | $26,970 | $1,700 | $25,270 |
| 2017 | $1,094 | $26,970 | $1,700 | $25,270 |
| 2016 | $1,030 | $26,970 | $1,700 | $25,270 |
| 2015 | $1,105 | $26,970 | $1,700 | $25,270 |
| 2014 | $1,167 | $28,490 | $3,900 | $24,590 |
Source: Public Records
Map
Nearby Homes
- 112 Ross Ave
- 104 Ross Ave
- 221 W Barton Ave
- 703-707 N Missouri St
- 1397 N Missouri St
- Lot 1-A N Missouri St
- 1399 N Missouri St
- 235 W Barton Ave
- 216 Roosevelt Ave
- 321 S Worthington Dr
- 123 W Danner Ave
- 307 W Cooper Ave
- 303 N Rhodes St
- 223 W Oliver Ave
- 301 Pine St
- 413 Gibson Ave
- 222 E Oliver Ave
- 451 S Roselawn Dr
- 1404 Chester Ln
- 323 W Oliver Ave