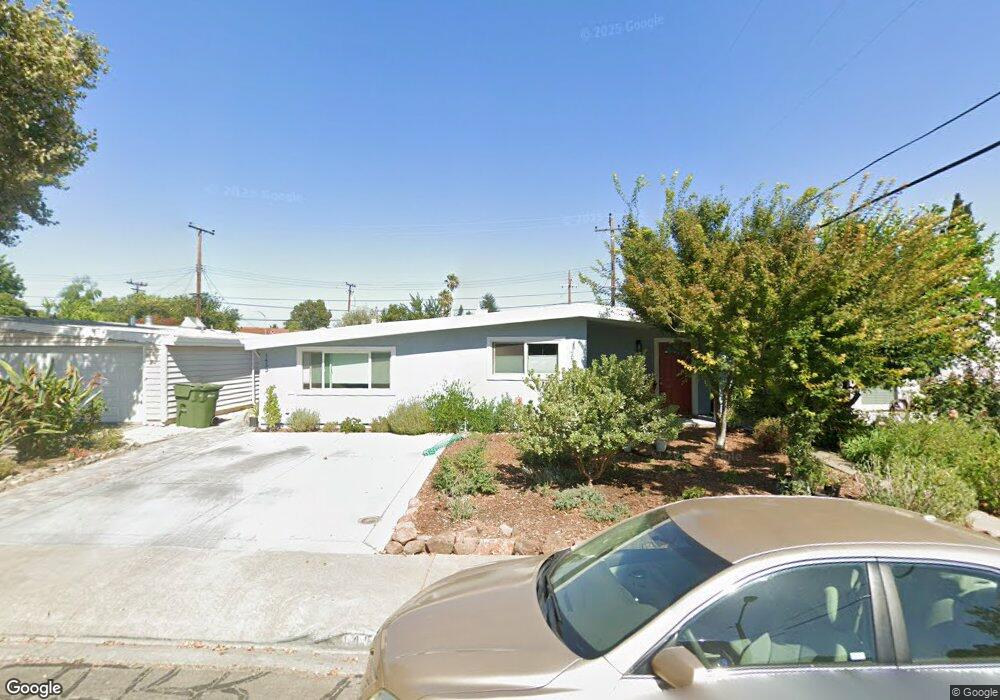
1451 Bergin Place Santa Clara, CA 95051
Estimated Value: $1,778,000 - $2,093,588
4
Beds
2
Baths
1,591
Sq Ft
$1,190/Sq Ft
Est. Value
About This Home
This home is located at 1451 Bergin Place, Santa Clara, CA 95051 and is currently estimated at $1,892,897, approximately $1,189 per square foot. 1451 Bergin Place is a home located in Santa Clara County with nearby schools including Pomeroy Elementary School, Juan Cabrillo Middle School, and Santa Clara High School.
Ownership History
Date
Name
Owned For
Owner Type
Purchase Details
Closed on
Feb 11, 2021
Sold by
Caliva Lepe Noren and Aguirre Noblena
Bought by
Caliva Lepe Noren and Aguirre Noblena
Current Estimated Value
Home Financials for this Owner
Home Financials are based on the most recent Mortgage that was taken out on this home.
Original Mortgage
$730,000
Outstanding Balance
$652,339
Interest Rate
2.65%
Mortgage Type
New Conventional
Estimated Equity
$1,240,558
Purchase Details
Closed on
Mar 26, 2012
Sold by
Caliva Noren and Aguirre Noblena
Bought by
Caliva Noren and Aguirre Noblena
Home Financials for this Owner
Home Financials are based on the most recent Mortgage that was taken out on this home.
Original Mortgage
$556,588
Interest Rate
4.25%
Mortgage Type
FHA
Purchase Details
Closed on
Jul 22, 2008
Sold by
Aleman Arturo E and Aleman Felix L
Bought by
Caliva Eileen and Caliva Noren
Home Financials for this Owner
Home Financials are based on the most recent Mortgage that was taken out on this home.
Original Mortgage
$583,219
Interest Rate
6.37%
Mortgage Type
FHA
Create a Home Valuation Report for This Property
The Home Valuation Report is an in-depth analysis detailing your home's value as well as a comparison with similar homes in the area
Home Values in the Area
Average Home Value in this Area
Purchase History
| Date | Buyer | Sale Price | Title Company |
|---|---|---|---|
| Caliva Lepe Noren | -- | Chicago Title Company | |
| Caliva Noren | -- | First American Title Company | |
| Cheng Eileen Caliva | -- | First American Title Company | |
| Caliva Noren | -- | First American Title Company | |
| Caliva Eileen | $605,000 | Cornerstone Title Co |
Source: Public Records
Mortgage History
| Date | Status | Borrower | Loan Amount |
|---|---|---|---|
| Open | Caliva Lepe Noren | $730,000 | |
| Closed | Cheng Eileen Caliva | $556,588 | |
| Closed | Caliva Eileen | $583,219 |
Source: Public Records
Tax History Compared to Growth
Tax History
| Year | Tax Paid | Tax Assessment Tax Assessment Total Assessment is a certain percentage of the fair market value that is determined by local assessors to be the total taxable value of land and additions on the property. | Land | Improvement |
|---|---|---|---|---|
| 2025 | $9,852 | $859,733 | $584,252 | $275,481 |
| 2024 | $9,852 | $842,877 | $572,797 | $270,080 |
| 2023 | $9,852 | $826,351 | $561,566 | $264,785 |
| 2022 | $9,669 | $810,149 | $550,555 | $259,594 |
| 2021 | $8,741 | $719,755 | $539,760 | $179,995 |
| 2020 | $8,583 | $712,376 | $534,226 | $178,150 |
| 2019 | $8,572 | $698,408 | $523,751 | $174,657 |
| 2018 | $8,022 | $684,715 | $513,482 | $171,233 |
| 2017 | $7,983 | $671,290 | $503,414 | $167,876 |
| 2016 | $7,825 | $658,129 | $493,544 | $164,585 |
| 2015 | $7,795 | $648,244 | $486,131 | $162,113 |
| 2014 | $7,406 | $635,547 | $476,609 | $158,938 |
Source: Public Records
Map
Nearby Homes
- 1545 Pomeroy Ave
- 1496 Mcpherson St
- 1661 Nobili Ave
- 3089 El Camino Real Unit 7
- 3089 El Camino Real Unit 5
- 3089 El Camino Real Unit 9
- 3089 El Camino Real Unit 11
- 3079 El Camino Real Unit 101
- 3079 El Camino Real Unit 202
- 3079 El Camino Real Unit 205
- 1101 Pomeroy Ave
- 2910 Jerald Ave
- 2038 Kington Place
- 2785 Ball Place Unit 4
- 1313 Kiely Blvd
- 3033 Kaiser Dr Unit H
- 3510 Cabrillo Ave
- 2782 Sonoma Place
- 954 Kiely Blvd Unit H
- 960 Kiely Blvd Unit F
- 1469 Bergin Place
- 1435 Bergin Place
- 1481 Bergin Place
- 1450 Pomeroy Ave
- 1421 Bergin Place
- 1468 Pomeroy Ave
- 1436 Pomeroy Ave
- 3342 Snively Ave
- 1488 Pomeroy Ave
- 1418 Pomeroy Ave
- 1436 Bergin Place
- 1501 Bergin Place
- 1418 Bergin Place
- 1502 Pomeroy Ave
- 1400 Bergin Place
- 3339 Snively Ave
- 1530 Pomeroy Ave
- 3310 Granada Ave
- 3343 Snively Ave