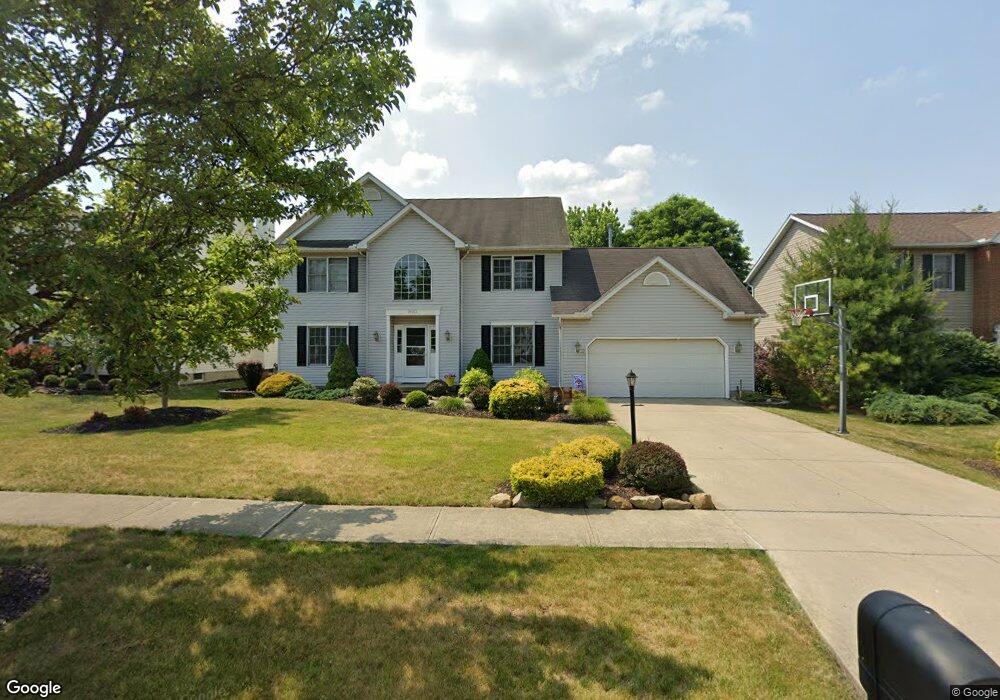
14513 Willow Cir Strongsville, OH 44136
Estimated Value: $412,324 - $451,000
4
Beds
3
Baths
2,554
Sq Ft
$166/Sq Ft
Est. Value
About This Home
This home is located at 14513 Willow Cir, Strongsville, OH 44136 and is currently estimated at $424,331, approximately $166 per square foot. 14513 Willow Cir is a home located in Cuyahoga County with nearby schools including Strongsville High School, The Academy of St. Bartholomew, and Royal Redeemer Lutheran School.
Ownership History
Date
Name
Owned For
Owner Type
Purchase Details
Closed on
Jul 25, 2001
Sold by
Jarzen Edward A
Bought by
Moscarino Richard J and Moscarino Michelle M
Current Estimated Value
Home Financials for this Owner
Home Financials are based on the most recent Mortgage that was taken out on this home.
Original Mortgage
$180,000
Outstanding Balance
$70,266
Interest Rate
7.16%
Estimated Equity
$354,065
Purchase Details
Closed on
Mar 20, 1996
Sold by
Cannon Builders Inc
Bought by
Jarzen Edward A and Jarzen Kathleen M
Home Financials for this Owner
Home Financials are based on the most recent Mortgage that was taken out on this home.
Original Mortgage
$185,345
Interest Rate
7.06%
Mortgage Type
New Conventional
Purchase Details
Closed on
Jan 12, 1995
Sold by
Saks Harvey S
Bought by
Cannon Builders Inc
Home Financials for this Owner
Home Financials are based on the most recent Mortgage that was taken out on this home.
Original Mortgage
$141,750
Interest Rate
9.23%
Mortgage Type
New Conventional
Create a Home Valuation Report for This Property
The Home Valuation Report is an in-depth analysis detailing your home's value as well as a comparison with similar homes in the area
Home Values in the Area
Average Home Value in this Area
Purchase History
| Date | Buyer | Sale Price | Title Company |
|---|---|---|---|
| Moscarino Richard J | $238,000 | Insignia Title Agency Ltd | |
| Jarzen Edward A | $195,100 | -- | |
| Cannon Builders Inc | $189,000 | -- |
Source: Public Records
Mortgage History
| Date | Status | Borrower | Loan Amount |
|---|---|---|---|
| Open | Moscarino Richard J | $180,000 | |
| Closed | Jarzen Edward A | $185,345 | |
| Previous Owner | Cannon Builders Inc | $141,750 |
Source: Public Records
Tax History Compared to Growth
Tax History
| Year | Tax Paid | Tax Assessment Tax Assessment Total Assessment is a certain percentage of the fair market value that is determined by local assessors to be the total taxable value of land and additions on the property. | Land | Improvement |
|---|---|---|---|---|
| 2024 | $5,513 | $117,425 | $24,325 | $93,100 |
| 2023 | $5,593 | $89,320 | $23,030 | $66,290 |
| 2022 | $5,552 | $89,320 | $23,030 | $66,290 |
| 2021 | $5,508 | $89,320 | $23,030 | $66,290 |
| 2020 | $5,368 | $77,000 | $19,850 | $57,160 |
| 2019 | $5,211 | $220,000 | $56,700 | $163,300 |
| 2018 | $4,729 | $77,000 | $19,850 | $57,160 |
| 2017 | $4,855 | $73,190 | $15,300 | $57,890 |
| 2016 | $4,816 | $73,190 | $15,300 | $57,890 |
| 2015 | $4,741 | $73,190 | $15,300 | $57,890 |
| 2014 | $4,741 | $71,050 | $14,840 | $56,210 |
Source: Public Records
Map
Nearby Homes
- 14069 Basswood Cir
- 9531 Nicole Cir
- 10010 Chevy Chase
- 0 Webster Rd
- 9890 Webster Rd
- Buchanan Plan at The Enclave at Pine Lakes Crossing
- Belleville Plan at The Enclave at Pine Lakes Crossing
- 15485 Albion Rd
- 14584 Baywood Ln
- 14557 Baywood Ln
- 14644 Baywood Ln
- 13402 Bridgecreek Cir
- 9129 Tahoe Cir
- 10560 Stapleton Dr
- 13861 Woodhawk Dr
- 9945 Twelve Oaks Cir
- 10471 Royal Oak Dr Unit 38-A
- 9286 Rainier Ct
- 10369 Council Bluff
- 12199 Webster Rd
- 14481 Willow Cir
- 14545 Willow Cir
- VL Willow Ln
- 14449 Willow Cir
- 14530 Willow Cir
- 14498 Willow Cir
- 14562 Willow Cir
- 14466 Willow Cir
- 10238 Lake Meadows Dr
- 10272 Lake Meadows Dr
- 10204 Lake Meadows Dr
- 14417 Willow Cir
- 10306 Lake Meadows Dr
- 10111 Lake Meadows Dr
- 10170 Lake Meadows Dr
- 14402 Willow Cir
- 14434 Willow Cir
- 14388 Timber Lake Dr
- 14453 Pine Lakes Dr
- 10340 Lake Meadows Dr