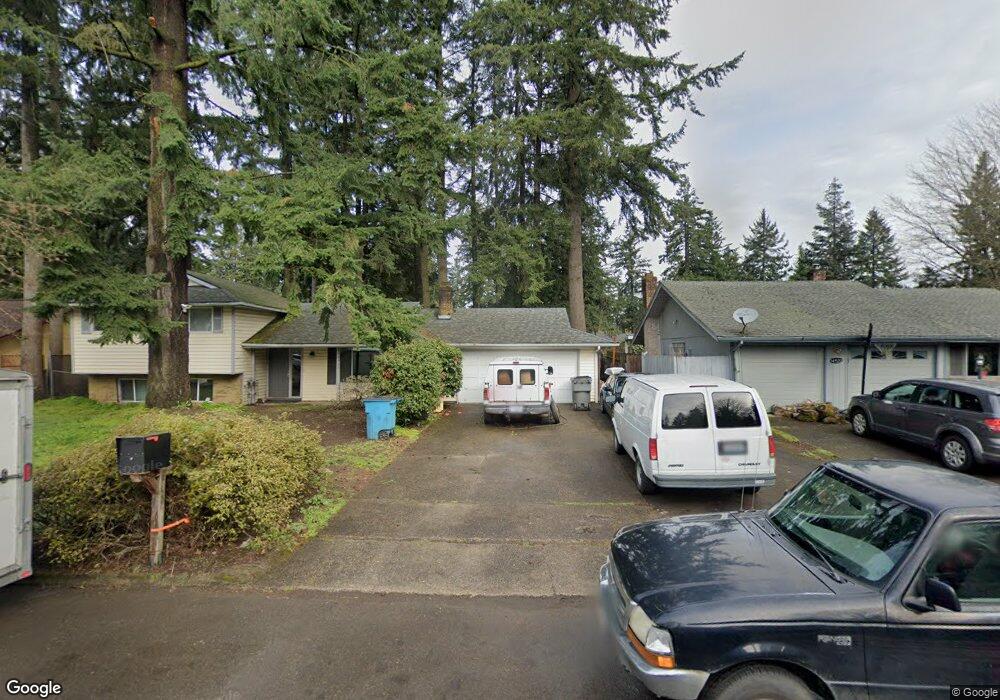
14516 NE Juniper Ave Vancouver, WA 98684
Estimated Value: $429,000 - $469,000
4
Beds
2
Baths
1,644
Sq Ft
$273/Sq Ft
Est. Value
About This Home
This home is located at 14516 NE Juniper Ave, Vancouver, WA 98684 and is currently estimated at $448,970, approximately $273 per square foot. 14516 NE Juniper Ave is a home located in Clark County with nearby schools including Hearthwood Elementary School, Cascade Middle School, and Evergreen High School.
Ownership History
Date
Name
Owned For
Owner Type
Purchase Details
Closed on
Jan 25, 2007
Sold by
Nielson Marili N
Bought by
Burns Cory B
Current Estimated Value
Home Financials for this Owner
Home Financials are based on the most recent Mortgage that was taken out on this home.
Original Mortgage
$47,800
Interest Rate
6.17%
Mortgage Type
Stand Alone Second
Purchase Details
Closed on
Sep 7, 2005
Sold by
Troxel Michael L and Troxel Tammy K
Bought by
Nielson Marili N
Home Financials for this Owner
Home Financials are based on the most recent Mortgage that was taken out on this home.
Original Mortgage
$140,000
Interest Rate
5.7%
Mortgage Type
Fannie Mae Freddie Mac
Purchase Details
Closed on
Jul 20, 2001
Sold by
Hotchkiss Mark A and Hotchkiss Angela L
Bought by
Troxel Michael L and Troxel Tammy K
Home Financials for this Owner
Home Financials are based on the most recent Mortgage that was taken out on this home.
Original Mortgage
$107,200
Interest Rate
7.87%
Create a Home Valuation Report for This Property
The Home Valuation Report is an in-depth analysis detailing your home's value as well as a comparison with similar homes in the area
Home Values in the Area
Average Home Value in this Area
Purchase History
| Date | Buyer | Sale Price | Title Company |
|---|---|---|---|
| Burns Cory B | $239,000 | Clark County Title Co | |
| Nielson Marili N | $175,000 | Clark County Title Co | |
| Troxel Michael L | $134,000 | Charter Title Corporation |
Source: Public Records
Mortgage History
| Date | Status | Borrower | Loan Amount |
|---|---|---|---|
| Closed | Burns Cory B | $47,800 | |
| Open | Burns Cory B | $191,200 | |
| Previous Owner | Nielson Marili N | $140,000 | |
| Previous Owner | Troxel Michael L | $107,200 | |
| Closed | Troxel Michael L | $26,800 |
Source: Public Records
Tax History Compared to Growth
Tax History
| Year | Tax Paid | Tax Assessment Tax Assessment Total Assessment is a certain percentage of the fair market value that is determined by local assessors to be the total taxable value of land and additions on the property. | Land | Improvement |
|---|---|---|---|---|
| 2025 | $3,706 | $383,704 | $188,500 | $195,204 |
| 2024 | $3,718 | $373,380 | $188,500 | $184,880 |
| 2023 | $3,739 | $386,158 | $192,850 | $193,308 |
| 2022 | $3,395 | $383,749 | $192,850 | $190,899 |
| 2021 | $3,053 | $330,241 | $165,300 | $164,941 |
| 2020 | $2,977 | $280,977 | $145,000 | $135,977 |
| 2019 | $2,610 | $276,640 | $115,800 | $160,840 |
| 2018 | $2,808 | $260,925 | $0 | $0 |
| 2017 | $2,581 | $225,721 | $0 | $0 |
| 2016 | $2,399 | $214,689 | $0 | $0 |
| 2015 | $2,299 | $190,958 | $0 | $0 |
| 2014 | -- | $174,912 | $0 | $0 |
| 2013 | -- | $160,018 | $0 | $0 |
Source: Public Records
Map
Nearby Homes
- 14517 NE Douglas Fir Ct
- 106 SE 152nd Ave
- 405 NE 152nd Ave
- 404 SE 150th Ct
- 15102 SE 5th St
- 714 NE 152nd Ave
- 713 NE 152nd Ave
- 604 NE 156th Ave
- 14308 SE 7th Way
- 14511 SE 7th Way
- 551 NE 137th Ave
- 1107 NE 147th Ave
- 14414 SE 8th St
- 712 NE 138th Place
- 510 SE 157th Ave Unit 37
- 510 SE 157th Ave Unit 38
- 522 SE 157th Ave Unit 14
- 14415 SE 9th St
- 15807 NE 2nd St
- 15813 SE 1st St
- 14522 NE Juniper Ave
- 14510 NE Juniper Ave
- 14419 NE Douglas Fir Ct
- 14413 NE Douglas Fir Ct
- 14505 NE Douglas Fir Ct
- 217 NE Hearthwood Blvd
- 14600 NE Juniper Ave
- 14519 NE Juniper Ave
- 14511 NE Juniper Ave
- 14511 NE Douglas Fir Ct
- 303 NE Hearthwood Blvd
- 14601 NE Juniper Ave
- 14505 NE Juniper Ave
- 14606 NE Juniper Ave
- 14605 NE Juniper Ave
- 14620 NE Coast Pine Ct
- 14420 NE Douglas Fir Ct
- 14504 NE Douglas Fir Ct
- 312 NE 147th Ave
- 14624 NE Coast Pine Ct