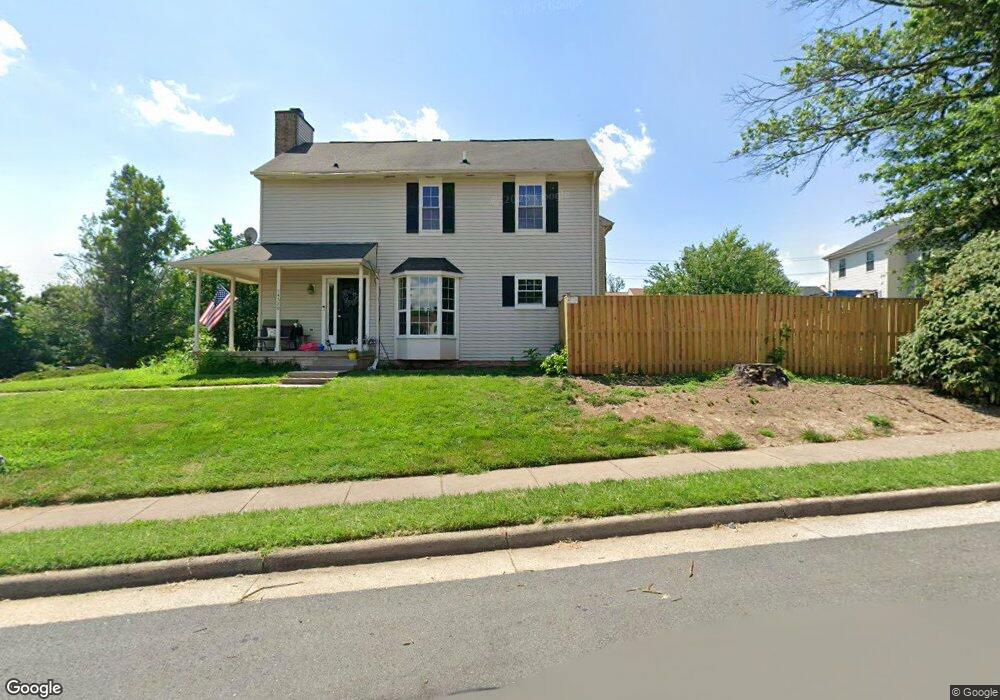
14536 Ravenscar Ct Centreville, VA 20121
Estimated Value: $498,000 - $534,000
3
Beds
3
Baths
1,372
Sq Ft
$373/Sq Ft
Est. Value
About This Home
This home is located at 14536 Ravenscar Ct, Centreville, VA 20121 and is currently estimated at $511,170, approximately $372 per square foot. 14536 Ravenscar Ct is a home located in Fairfax County with nearby schools including Bull Run Elementary School, Liberty Middle School, and Centreville High School.
Ownership History
Date
Name
Owned For
Owner Type
Purchase Details
Closed on
May 23, 2005
Sold by
Cooper Brian L
Bought by
Luo Liping and Zhang,Yucheng
Current Estimated Value
Home Financials for this Owner
Home Financials are based on the most recent Mortgage that was taken out on this home.
Original Mortgage
$290,000
Outstanding Balance
$152,275
Interest Rate
5.95%
Mortgage Type
New Conventional
Estimated Equity
$358,895
Purchase Details
Closed on
Oct 26, 2000
Sold by
Ambrose Maria L
Bought by
Cooper Brian L
Home Financials for this Owner
Home Financials are based on the most recent Mortgage that was taken out on this home.
Original Mortgage
$111,900
Interest Rate
7.83%
Purchase Details
Closed on
Jul 28, 1997
Sold by
Director Family Trust
Bought by
Demayo Maria Lc
Home Financials for this Owner
Home Financials are based on the most recent Mortgage that was taken out on this home.
Original Mortgage
$108,950
Interest Rate
7.7%
Mortgage Type
FHA
Create a Home Valuation Report for This Property
The Home Valuation Report is an in-depth analysis detailing your home's value as well as a comparison with similar homes in the area
Home Values in the Area
Average Home Value in this Area
Purchase History
| Date | Buyer | Sale Price | Title Company |
|---|---|---|---|
| Luo Liping | $363,000 | -- | |
| Cooper Brian L | $139,900 | -- | |
| Demayo Maria Lc | $110,000 | -- |
Source: Public Records
Mortgage History
| Date | Status | Borrower | Loan Amount |
|---|---|---|---|
| Open | Luo Liping | $290,000 | |
| Previous Owner | Cooper Brian L | $111,900 | |
| Previous Owner | Demayo Maria Lc | $108,950 |
Source: Public Records
Tax History Compared to Growth
Tax History
| Year | Tax Paid | Tax Assessment Tax Assessment Total Assessment is a certain percentage of the fair market value that is determined by local assessors to be the total taxable value of land and additions on the property. | Land | Improvement |
|---|---|---|---|---|
| 2025 | $5,062 | $460,690 | $145,000 | $315,690 |
| 2024 | $5,062 | $436,930 | $145,000 | $291,930 |
| 2023 | $4,868 | $431,370 | $145,000 | $286,370 |
| 2022 | $4,538 | $396,840 | $115,000 | $281,840 |
| 2021 | $4,168 | $355,200 | $110,000 | $245,200 |
| 2020 | $4,020 | $339,700 | $105,000 | $234,700 |
| 2019 | $3,764 | $318,070 | $92,000 | $226,070 |
| 2018 | $3,658 | $318,070 | $92,000 | $226,070 |
| 2017 | $3,534 | $304,430 | $87,000 | $217,430 |
| 2016 | $3,446 | $297,430 | $82,000 | $215,430 |
| 2015 | $3,183 | $285,240 | $77,000 | $208,240 |
| 2014 | $2,833 | $254,410 | $67,000 | $187,410 |
Source: Public Records
Map
Nearby Homes
- 14504 Ravenscar Ct
- 15119 - LOT 2 Compton Rd
- 15119- LOT 3 Compton Rd
- 7003 Centreville Rd
- 6789 Stone Maple Terrace
- 14506 Crim Station Rd
- 14216 Hartwood Ct
- 6605 English Saddle Ct
- 6488 Palisades Dr
- 14159 Autumn Cir
- 14146 Red River Dr
- 14102 Autumn Cir
- 13910 Stonefield Ln
- 8514 Charnwood Ct
- 8524 Charnwood Ct
- 14079 Red River Dr
- 7555 Kimberton Ct
- 6316 Mary Todd Ln
- 14096 Winding Ridge Ln
- 15056 Brown Post Ln
- 14534 Ravenscar Ct
- 14532 Ravenscar Ct
- 14530 Ravenscar Ct
- 14506 Ravenscar Ct
- 14502 Ravenscar Ct
- 14500 Ravenscar Ct
- 14535 Ravenscar Ct
- 14537 Ravenscar Ct
- 14533 Ravenscar Ct
- 14531 Ravenscar Ct
- 14527 Ravenscar Ct
- 14525 Ravenscar Ct
- 14523 Ravenscar Ct
- 14521 Ravenscar Ct
- 14501 Skipton Ct
- 14519 Ravenscar Ct
- 14503 Skipton Ct
- 14509 Ravenscar Ct
- 14511 Ravenscar Ct
- 14507 Ravenscar Ct