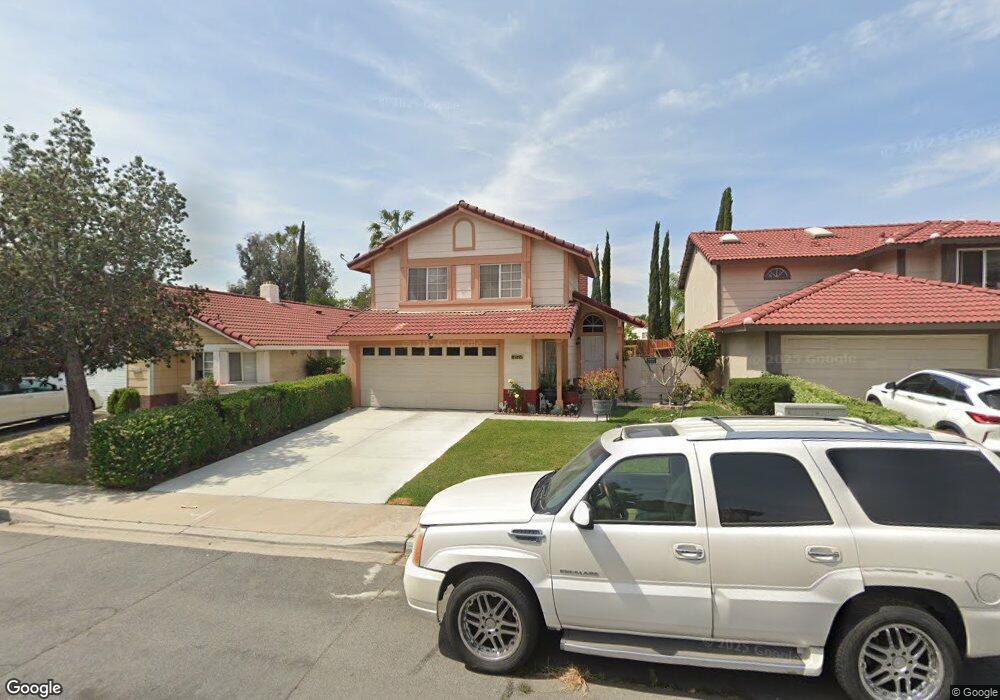
14564 El Contento Ave Fontana, CA 92337
Southridge Village NeighborhoodEstimated Value: $562,958 - $601,000
3
Beds
3
Baths
1,408
Sq Ft
$412/Sq Ft
Est. Value
About This Home
This home is located at 14564 El Contento Ave, Fontana, CA 92337 and is currently estimated at $579,990, approximately $411 per square foot. 14564 El Contento Ave is a home located in San Bernardino County with nearby schools including Shadow Hills Elementary School, Southridge Middle School, and Henry J. Kaiser High School.
Ownership History
Date
Name
Owned For
Owner Type
Purchase Details
Closed on
Mar 13, 2024
Sold by
Rivas Rafael G and Rivas Maria
Bought by
Rm Rivas Trust and Rivas
Current Estimated Value
Purchase Details
Closed on
Oct 14, 1994
Sold by
Ruderman Harlan Thomas
Bought by
Rivas Rafael G and Rivas Maria E
Home Financials for this Owner
Home Financials are based on the most recent Mortgage that was taken out on this home.
Original Mortgage
$99,750
Interest Rate
9.2%
Purchase Details
Closed on
Sep 23, 1994
Sold by
Ruderman Harlan Thomas and Ruderman Daniel Mark
Bought by
Ruderman Harlan Thomas
Home Financials for this Owner
Home Financials are based on the most recent Mortgage that was taken out on this home.
Original Mortgage
$99,750
Interest Rate
9.2%
Create a Home Valuation Report for This Property
The Home Valuation Report is an in-depth analysis detailing your home's value as well as a comparison with similar homes in the area
Home Values in the Area
Average Home Value in this Area
Purchase History
| Date | Buyer | Sale Price | Title Company |
|---|---|---|---|
| Rm Rivas Trust | -- | None Listed On Document | |
| Rivas Rafael G | -- | None Listed On Document | |
| Rivas Rafael G | -- | Commonwealth Land Title Co | |
| Ruderman Harlan Thomas | -- | -- |
Source: Public Records
Mortgage History
| Date | Status | Borrower | Loan Amount |
|---|---|---|---|
| Previous Owner | Rivas Rafael G | $99,750 |
Source: Public Records
Tax History Compared to Growth
Tax History
| Year | Tax Paid | Tax Assessment Tax Assessment Total Assessment is a certain percentage of the fair market value that is determined by local assessors to be the total taxable value of land and additions on the property. | Land | Improvement |
|---|---|---|---|---|
| 2025 | $2,910 | $176,369 | $44,176 | $132,193 |
| 2024 | $2,910 | $172,911 | $43,310 | $129,601 |
| 2023 | $2,501 | $169,521 | $42,461 | $127,060 |
| 2022 | $2,477 | $166,197 | $41,628 | $124,569 |
| 2021 | $2,439 | $162,938 | $40,812 | $122,126 |
| 2020 | $2,434 | $161,268 | $40,394 | $120,874 |
| 2019 | $2,382 | $158,106 | $39,602 | $118,504 |
| 2018 | $2,405 | $155,005 | $38,825 | $116,180 |
| 2017 | $2,394 | $151,966 | $38,064 | $113,902 |
| 2016 | $2,365 | $148,987 | $37,318 | $111,669 |
| 2015 | $2,344 | $146,749 | $36,757 | $109,992 |
| 2014 | $2,343 | $143,874 | $36,037 | $107,837 |
Source: Public Records
Map
Nearby Homes
- 11798 Rustic Place
- 11820 Rustic Place
- 11840 Rustic Place
- 14421 El Contento Ave
- 14601 Long View Dr
- 14791 Mountain High Dr
- Plan 2056 at Parkview - Canopy at Parkview
- Plan 1791 at Parkview - Canopy at Parkview
- Plan 2320 at Parkview - Canopy at Parkview
- 11919 Woodbridge Dr
- 14213 Ranchero Dr
- 11431 Winery Dr
- 14241 Elizabeth Ct
- 14515 Woodland Dr Unit 10
- 11394 Aqua Ct
- 11308 Sherwood Ct
- 11346 Oak Knoll Dr
- 14018 Ridgewood Dr
- 12045 Glenheather Dr
- 11557 Oakwood Dr
- 14562 El Contento Ave
- 14568 El Contento Ave
- 11701 Rustic Place
- 14570 El Contento Ave
- 14560 El Contento Ave
- 14574 El Contento Ave
- 11723 Rustic Place
- 14569 El Contento Ave
- 14565 El Contento Ave
- 14573 El Contento Ave
- 14563 El Contento Ave
- 11702 Rustic Place
- 14572 Elderwood Dr
- 14580 Elderwood Dr
- 14576 El Contento Ave
- 14566 Elderwood Dr
- 14577 El Contento Ave
- 14559 El Contento Ave
- 14552 Elderwood Dr
- 11716 Rustic Place