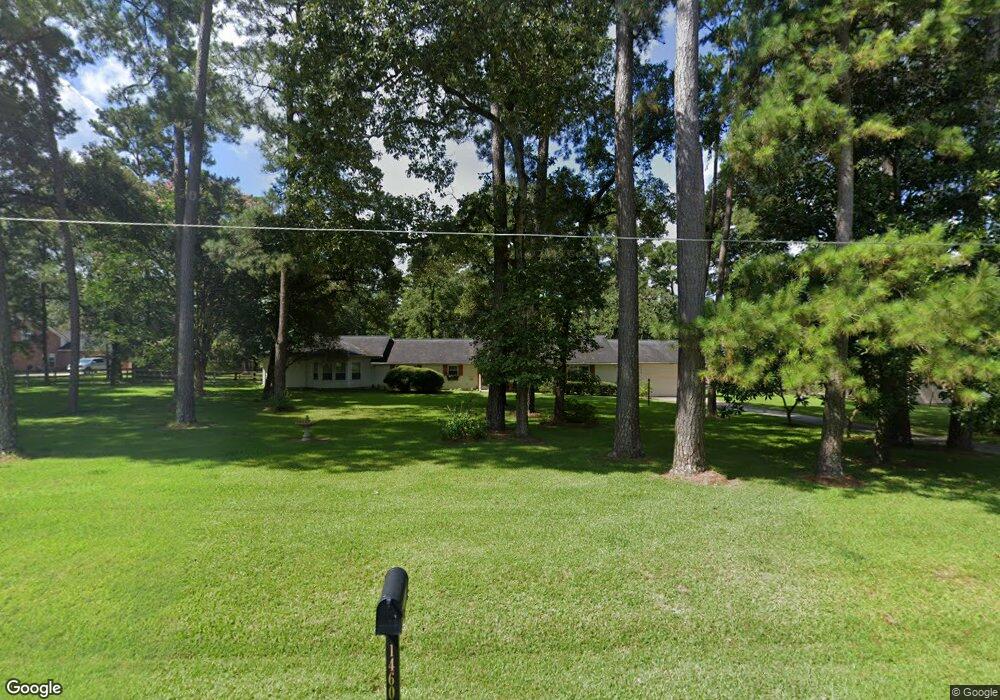
14603 Decker Dr Magnolia, TX 77355
Estimated Value: $610,000 - $640,000
--
Bed
2
Baths
2,642
Sq Ft
$239/Sq Ft
Est. Value
About This Home
This home is located at 14603 Decker Dr, Magnolia, TX 77355 and is currently estimated at $631,675, approximately $239 per square foot. 14603 Decker Dr is a home located in Montgomery County with nearby schools including Decker Prairie Elementary School, Tomball Intermediate School, and Tomball Junior High School.
Ownership History
Date
Name
Owned For
Owner Type
Purchase Details
Closed on
Nov 17, 2020
Sold by
Gonzalez Gary and Gonzalez Lillian
Bought by
Windham Bobby E and Windham Paula K
Current Estimated Value
Purchase Details
Closed on
Oct 19, 2005
Sold by
Gmac Global Relocation Services Inc
Bought by
Gonzalez Adolph and Gonzalez Lillian
Purchase Details
Closed on
Oct 14, 2005
Sold by
Aaron Laura R and Aaron Gary G
Bought by
Gmac Global Relocation Services Inc
Purchase Details
Closed on
Dec 22, 1995
Sold by
Bowling Charles E
Bought by
Gonzalez Adolph and Gonzalez Lillian
Home Financials for this Owner
Home Financials are based on the most recent Mortgage that was taken out on this home.
Original Mortgage
$114,400
Interest Rate
7.34%
Purchase Details
Closed on
Jun 20, 1978
Sold by
Hickory Hills Joint Venture
Bought by
Bowling Charles E and Bowling Gladys Lee
Create a Home Valuation Report for This Property
The Home Valuation Report is an in-depth analysis detailing your home's value as well as a comparison with similar homes in the area
Home Values in the Area
Average Home Value in this Area
Purchase History
| Date | Buyer | Sale Price | Title Company |
|---|---|---|---|
| Windham Bobby E | -- | Alamo Title Company | |
| Gonzalez Adolph | -- | Stewart Title Houston Div | |
| Gmac Global Relocation Services Inc | -- | Stewart Title Houston Div | |
| Gonzalez Adolph | -- | -- | |
| Aaron Laura R | -- | Texas American Title Company | |
| Bowling Charles E | -- | Fidelity National Title |
Source: Public Records
Mortgage History
| Date | Status | Borrower | Loan Amount |
|---|---|---|---|
| Previous Owner | Aaron Laura R | $114,400 |
Source: Public Records
Tax History Compared to Growth
Tax History
| Year | Tax Paid | Tax Assessment Tax Assessment Total Assessment is a certain percentage of the fair market value that is determined by local assessors to be the total taxable value of land and additions on the property. | Land | Improvement |
|---|---|---|---|---|
| 2025 | $3,983 | $411,715 | -- | -- |
| 2024 | $3,589 | $374,286 | -- | -- |
| 2023 | $3,589 | $340,260 | $60,300 | $354,470 |
| 2022 | $5,715 | $309,330 | $60,300 | $354,470 |
| 2021 | $5,403 | $281,210 | $60,300 | $220,910 |
| 2020 | $5,730 | $285,890 | $60,300 | $225,590 |
| 2019 | $5,422 | $274,640 | $60,300 | $214,340 |
| 2018 | $3,870 | $251,320 | $60,300 | $201,960 |
| 2017 | $4,754 | $228,470 | $26,510 | $201,960 |
| 2016 | $5,535 | $265,960 | $26,510 | $240,430 |
| 2015 | $2,332 | $241,780 | $26,510 | $224,720 |
| 2014 | $2,332 | $219,800 | $26,510 | $193,290 |
Source: Public Records
Map
Nearby Homes
- 33302 Alton Wright Dr
- 33401 Doe Dr
- Lot 11 Walnut Grove Ln
- Lot 9 Walnut Grove Ln
- Lot 10 Walnut Grove Ln
- 15245 Shady Oaks Dr
- 14810 Timberleaf Dr
- 15450 Shady Oaks Dr
- 2102 Candy St
- 15823 Stagecoach Rd
- 15629 Knotty Oaks Trail
- 2103 Diane St
- 15937 Stagecoach Rd
- 14419 Timbergreen Dr
- 15901 Butera Rd
- 0 Frontier Rd
- 14003 Timbergreen Dr
- 15019 Timbershire Ct
- 1443 Northwood Bluff Ln
- 1439 Northwood Bluff Ln
- 14607 Decker Dr
- 14602 Decker Dr
- 14515 Decker Dr
- 14606 Decker Dr
- 14511 Decker Dr
- 14611 Decker Dr
- 14507 Decker Dr
- 14508 Decker Dr
- 14513 Decker Dr
- 14506 Decker Dr
- 33515 Doe Dr
- 14504 Decker Dr
- 14507 Doe Ct
- 33226 Alton Wright Dr
- 14511 Doe Ct
- 14502 Decker Dr
- 33507 Doe Dr
- 33434 Doe Dr
- 33426 Doe Dr
- 33314 Alton Wright Dr