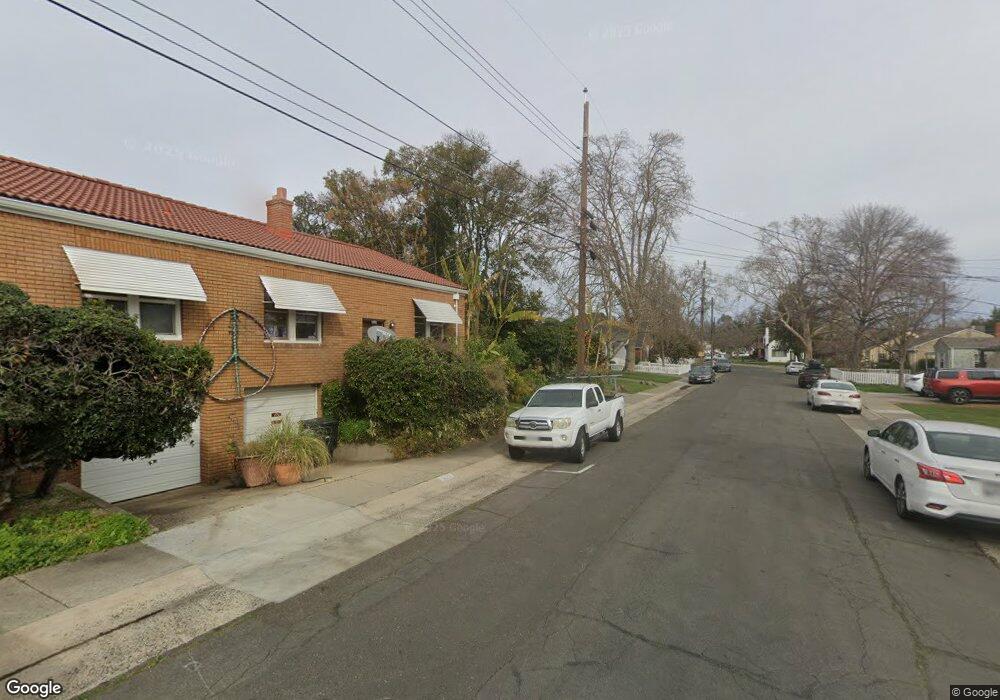
1466 52nd St Sacramento, CA 95819
East Sacramento NeighborhoodEstimated Value: $569,182 - $647,000
3
Beds
1
Bath
1,045
Sq Ft
$584/Sq Ft
Est. Value
About This Home
This home is located at 1466 52nd St, Sacramento, CA 95819 and is currently estimated at $610,296, approximately $584 per square foot. 1466 52nd St is a home located in Sacramento County with nearby schools including Caleb Greenwood Elementary, Umoja International Academy, and Hiram W. Johnson High School.
Ownership History
Date
Name
Owned For
Owner Type
Purchase Details
Closed on
May 4, 1998
Sold by
Gann Lisa Wisinger and Wisinger Lisa Ann
Bought by
Leeds Diane J
Current Estimated Value
Home Financials for this Owner
Home Financials are based on the most recent Mortgage that was taken out on this home.
Original Mortgage
$139,600
Outstanding Balance
$27,158
Interest Rate
7.05%
Estimated Equity
$583,138
Purchase Details
Closed on
Nov 8, 1995
Sold by
Buckwalter Henry George and Buckwalter Cheryl Lynn
Bought by
Wisinger Lisa Ann
Home Financials for this Owner
Home Financials are based on the most recent Mortgage that was taken out on this home.
Original Mortgage
$129,600
Interest Rate
7.58%
Purchase Details
Closed on
Dec 15, 1993
Sold by
Miller Thomas W and Miller Darlene K
Bought by
Buckwalter Henry George and Buckwalter Cheryl Lynn
Home Financials for this Owner
Home Financials are based on the most recent Mortgage that was taken out on this home.
Original Mortgage
$152,660
Interest Rate
7.09%
Mortgage Type
FHA
Create a Home Valuation Report for This Property
The Home Valuation Report is an in-depth analysis detailing your home's value as well as a comparison with similar homes in the area
Home Values in the Area
Average Home Value in this Area
Purchase History
| Date | Buyer | Sale Price | Title Company |
|---|---|---|---|
| Leeds Diane J | $174,500 | Chicago Title Co | |
| Wisinger Lisa Ann | $162,000 | North American Title Co | |
| Buckwalter Henry George | $155,000 | Chicago Title Company |
Source: Public Records
Mortgage History
| Date | Status | Borrower | Loan Amount |
|---|---|---|---|
| Open | Leeds Diane J | $139,600 | |
| Previous Owner | Wisinger Lisa Ann | $129,600 | |
| Previous Owner | Buckwalter Henry George | $152,660 |
Source: Public Records
Tax History Compared to Growth
Tax History
| Year | Tax Paid | Tax Assessment Tax Assessment Total Assessment is a certain percentage of the fair market value that is determined by local assessors to be the total taxable value of land and additions on the property. | Land | Improvement |
|---|---|---|---|---|
| 2025 | $3,225 | $278,604 | $95,790 | $182,814 |
| 2024 | $3,225 | $273,142 | $93,912 | $179,230 |
| 2023 | $3,148 | $267,787 | $92,071 | $175,716 |
| 2022 | $3,093 | $262,537 | $90,266 | $172,271 |
| 2021 | $2,945 | $257,391 | $88,497 | $168,894 |
| 2020 | $2,968 | $254,753 | $87,590 | $167,163 |
| 2019 | $2,904 | $249,759 | $85,873 | $163,886 |
| 2018 | $2,827 | $244,863 | $84,190 | $160,673 |
| 2017 | $2,786 | $240,063 | $82,540 | $157,523 |
| 2016 | $2,711 | $235,357 | $80,922 | $154,435 |
| 2015 | $2,670 | $231,823 | $79,707 | $152,116 |
| 2014 | $2,597 | $227,283 | $78,146 | $149,137 |
Source: Public Records
Map
Nearby Homes