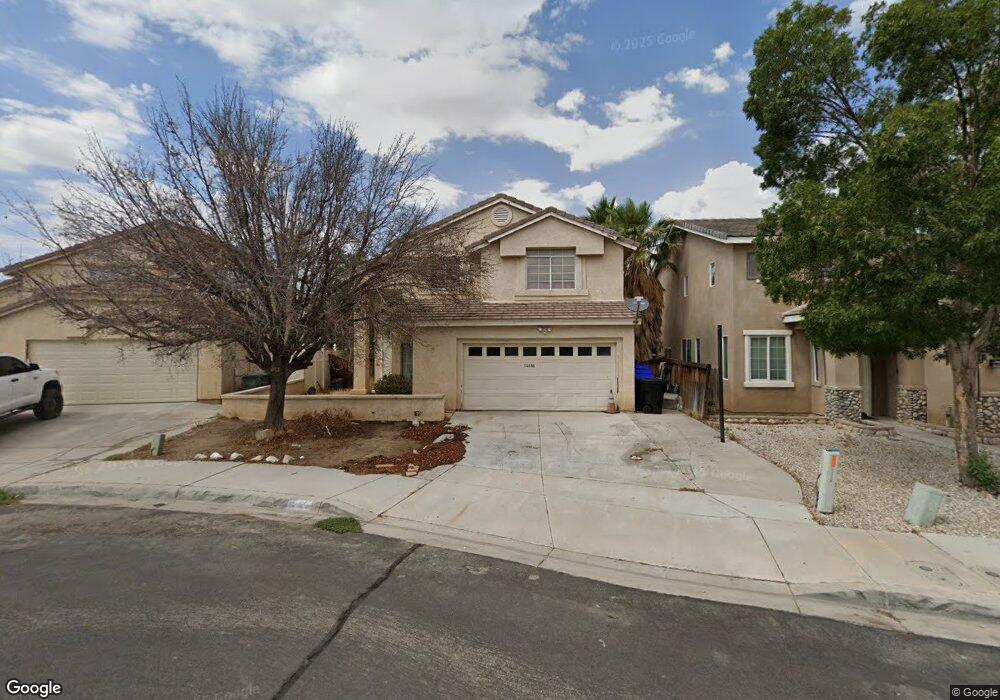
14688 Ann Dr Victorville, CA 92394
Estimated Value: $410,813 - $438,000
4
Beds
3
Baths
1,830
Sq Ft
$230/Sq Ft
Est. Value
About This Home
This home is located at 14688 Ann Dr, Victorville, CA 92394 and is currently estimated at $421,453, approximately $230 per square foot. 14688 Ann Dr is a home located in San Bernardino County with nearby schools including Village Elementary School, Brentwood Elementary School, and Challenger School Of Sports And Fitness.
Ownership History
Date
Name
Owned For
Owner Type
Purchase Details
Closed on
Sep 9, 1997
Sold by
Williams Stanley and Williams Judy
Bought by
Lloyd Johnnie L
Current Estimated Value
Home Financials for this Owner
Home Financials are based on the most recent Mortgage that was taken out on this home.
Original Mortgage
$105,040
Interest Rate
7.36%
Mortgage Type
FHA
Purchase Details
Closed on
Aug 4, 1997
Sold by
Hud
Bought by
Williams Staley E and Williams Judy A
Home Financials for this Owner
Home Financials are based on the most recent Mortgage that was taken out on this home.
Original Mortgage
$105,040
Interest Rate
7.36%
Mortgage Type
FHA
Purchase Details
Closed on
Dec 30, 1996
Sold by
Nicoletti Darice
Bought by
Countrywide Home Loans Inc and Countrywide Funding Corp
Purchase Details
Closed on
Dec 9, 1996
Sold by
Countrywide Home Loans Inc
Bought by
Hud
Create a Home Valuation Report for This Property
The Home Valuation Report is an in-depth analysis detailing your home's value as well as a comparison with similar homes in the area
Home Values in the Area
Average Home Value in this Area
Purchase History
| Date | Buyer | Sale Price | Title Company |
|---|---|---|---|
| Lloyd Johnnie L | $105,500 | First American Title Ins Co | |
| Williams Staley E | $78,000 | Old Republic Title Company | |
| Countrywide Home Loans Inc | $123,989 | Landsafe Title | |
| Hud | -- | Landsafe Title |
Source: Public Records
Mortgage History
| Date | Status | Borrower | Loan Amount |
|---|---|---|---|
| Previous Owner | Lloyd Johnnie L | $105,040 | |
| Previous Owner | Williams Staley E | $77,362 |
Source: Public Records
Tax History Compared to Growth
Tax History
| Year | Tax Paid | Tax Assessment Tax Assessment Total Assessment is a certain percentage of the fair market value that is determined by local assessors to be the total taxable value of land and additions on the property. | Land | Improvement |
|---|---|---|---|---|
| 2025 | $1,924 | $168,457 | $19,161 | $149,296 |
| 2024 | $1,924 | $165,154 | $18,785 | $146,369 |
| 2023 | $1,904 | $161,916 | $18,417 | $143,499 |
| 2022 | $1,870 | $158,741 | $18,056 | $140,685 |
| 2021 | $1,835 | $155,628 | $17,702 | $137,926 |
| 2020 | $1,802 | $154,032 | $17,520 | $136,512 |
| 2019 | $1,771 | $151,011 | $17,176 | $133,835 |
| 2018 | $1,884 | $148,050 | $16,839 | $131,211 |
| 2017 | $1,844 | $145,147 | $16,509 | $128,638 |
| 2016 | $1,806 | $142,301 | $16,185 | $126,116 |
| 2015 | $1,754 | $140,164 | $15,942 | $124,222 |
| 2014 | $1,708 | $137,419 | $15,630 | $121,789 |
Source: Public Records
Map
Nearby Homes
- 14789 Rosemary Dr
- 14912 Brigadoon Ln
- 14724 Rockrose St
- 14470 Green River Rd
- 14571 Apache Dr
- 15115 Fresh Water Way
- 14433 El Grande Way
- 15227 Flagstaff St
- 14304 Gray Fox Ln
- 15132 Jeraldo Dr
- 14285 Wildcat Ln
- 14412 Moon Valley St
- 15376 San Miguel Way
- 15056 Dakota St
- 15252 Seneca Rd
- 15252 Seneca Rd Unit 336
- 15252 Seneca Rd Unit 311
- 15252 Seneca Rd Unit 319
- 15252 Seneca Rd Unit 178
- 15252 Seneca Rd Unit 13