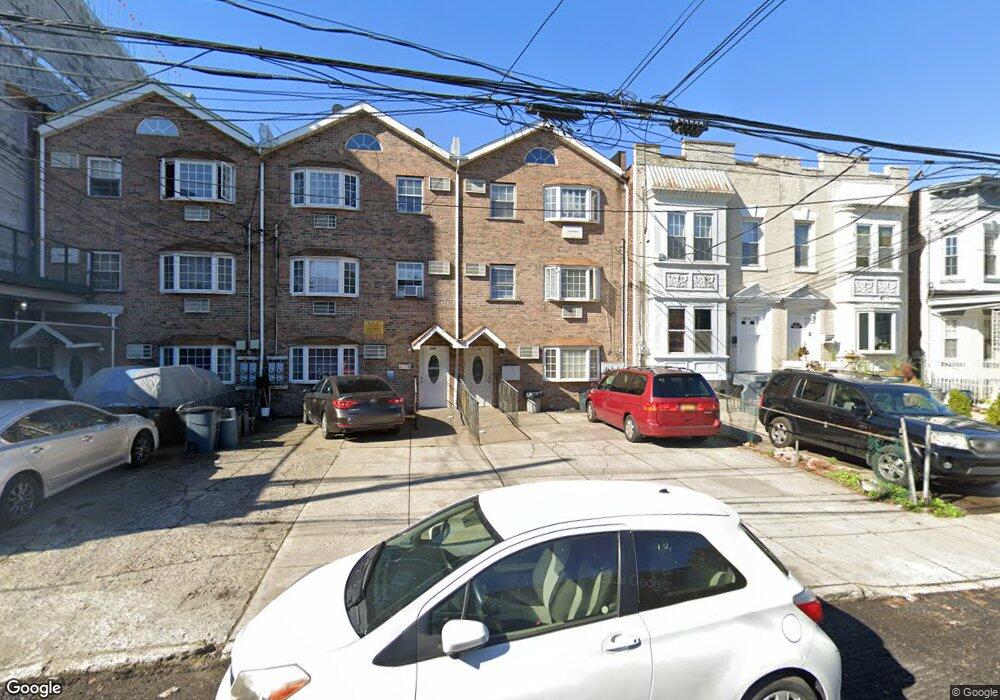
1472 New York Ave Brooklyn, NY 11210
Flatbush NeighborhoodEstimated Value: $1,068,015 - $1,325,000
--
Bed
--
Bath
3,240
Sq Ft
$356/Sq Ft
Est. Value
About This Home
This home is located at 1472 New York Ave, Brooklyn, NY 11210 and is currently estimated at $1,154,754, approximately $356 per square foot. 1472 New York Ave is a home located in Kings County with nearby schools including J.H.S. 278 Marine Park, Jhs 234 Arthur W Cunningham, and Jhs 14 Shell Bank.
Ownership History
Date
Name
Owned For
Owner Type
Purchase Details
Closed on
Oct 21, 2009
Sold by
Frierson Ivy
Bought by
Strachan Deborah C and Strachan Roger R
Current Estimated Value
Home Financials for this Owner
Home Financials are based on the most recent Mortgage that was taken out on this home.
Original Mortgage
$531,643
Interest Rate
5.02%
Mortgage Type
Purchase Money Mortgage
Purchase Details
Closed on
May 3, 2007
Sold by
Frierson Ivy
Bought by
Frierson Ivy and John Christopher
Purchase Details
Closed on
Nov 1, 2006
Sold by
1482 New York Corp
Bought by
Frierson Ivy
Home Financials for this Owner
Home Financials are based on the most recent Mortgage that was taken out on this home.
Original Mortgage
$642,400
Interest Rate
6.4%
Mortgage Type
Purchase Money Mortgage
Purchase Details
Closed on
Mar 16, 2004
Sold by
Britt Mary
Bought by
Jackpot Development Corp
Create a Home Valuation Report for This Property
The Home Valuation Report is an in-depth analysis detailing your home's value as well as a comparison with similar homes in the area
Home Values in the Area
Average Home Value in this Area
Purchase History
| Date | Buyer | Sale Price | Title Company |
|---|---|---|---|
| Strachan Deborah C | $550,000 | -- | |
| Frierson Ivy | -- | -- | |
| Frierson Ivy | $803,000 | -- | |
| Jackpot Development Corp | $335,000 | -- |
Source: Public Records
Mortgage History
| Date | Status | Borrower | Loan Amount |
|---|---|---|---|
| Previous Owner | Strachan Deborah C | $531,643 | |
| Previous Owner | Frierson Ivy | $642,400 |
Source: Public Records
Tax History Compared to Growth
Tax History
| Year | Tax Paid | Tax Assessment Tax Assessment Total Assessment is a certain percentage of the fair market value that is determined by local assessors to be the total taxable value of land and additions on the property. | Land | Improvement |
|---|---|---|---|---|
| 2025 | $9,249 | $53,040 | $21,540 | $31,500 |
| 2024 | $9,249 | $55,200 | $21,540 | $33,660 |
| 2023 | $8,823 | $48,780 | $21,540 | $27,240 |
| 2022 | $8,182 | $53,460 | $21,540 | $31,920 |
| 2021 | $8,137 | $44,640 | $21,540 | $23,100 |
| 2020 | $4,045 | $54,120 | $21,540 | $32,580 |
| 2019 | $8,027 | $43,020 | $21,540 | $21,480 |
| 2018 | $7,380 | $36,202 | $17,306 | $18,896 |
| 2017 | $6,962 | $34,153 | $16,912 | $17,241 |
| 2016 | $6,441 | $32,220 | $21,540 | $10,680 |
| 2015 | $4,645 | $33,962 | $22,142 | $11,820 |
| 2014 | $4,645 | $32,040 | $23,940 | $8,100 |
Source: Public Records
Map
Nearby Homes
- 1455 New York Ave
- 1462 New York Ave
- 563 E 32nd St
- 785 E 34th St Unit 3-C
- 566 E 32nd St
- 1410 Avenue S Unit 1A
- 720 Brooklyn Ave Unit 5K
- 890 E 34th St
- 579 E 29th St
- 775 E 37th St
- 3521 Glenwood Rd
- 2913 Foster Ave Unit 6F
- 2913 Foster Ave Unit 2F
- 2913 Foster Ave Unit 2E
- 2913 Foster Ave Unit 4F
- 2913 Foster Ave Unit 3D
- 2913 Foster Ave Unit 6G
- 2913 Foster Ave Unit 6-H
- 1322 New York Ave
- 2804 Farragut Rd
- 1470 New York Ave
- 1474 New York Ave
- 1468 New York Ave
- 1478 New York Ave
- 1466 New York Ave
- 1464 New York Ave
- 573 E 32nd St
- 1488 New York Ave
- 569 E 32nd St
- 1460 New York Ave
- 1460 New York Ave Unit 1
- 1460 New York Ave Unit 2
- 1456 New York Ave
- 561 E 32nd St
- 1452 New York Ave
- 559 E 32nd St
- 1465 New York Ave
- 1465 New York Ave Unit 2B
- 1465 New York Ave Unit 2A
- 1473 New York Ave