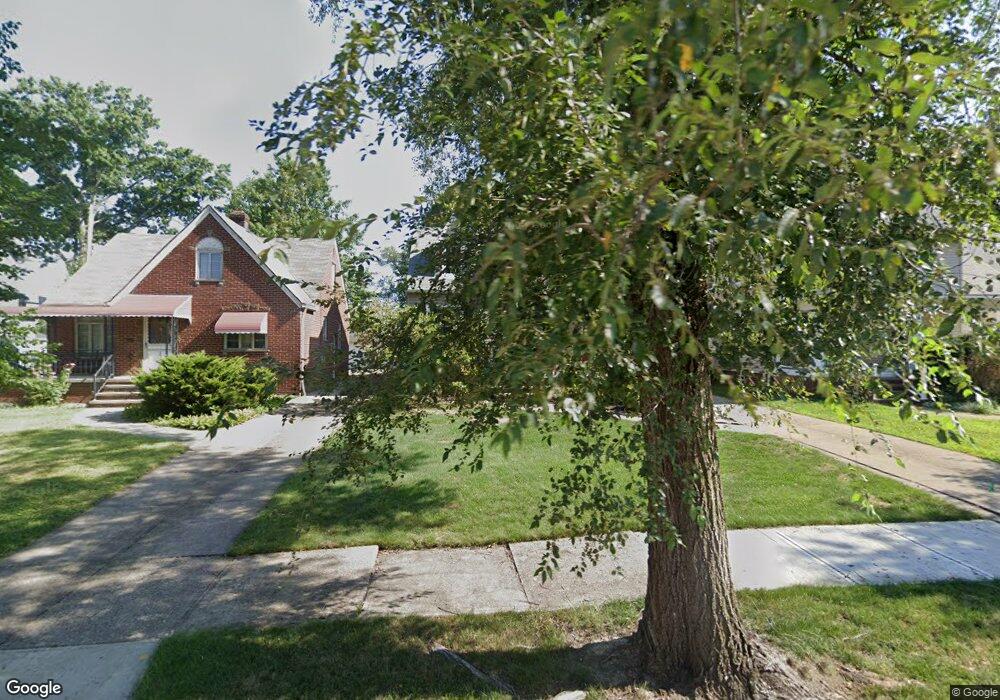
14724 Fernway Ave Cleveland, OH 44111
Kamm's Corners NeighborhoodEstimated Value: $209,000 - $245,000
3
Beds
2
Baths
1,308
Sq Ft
$173/Sq Ft
Est. Value
About This Home
This home is located at 14724 Fernway Ave, Cleveland, OH 44111 and is currently estimated at $225,689, approximately $172 per square foot. 14724 Fernway Ave is a home located in Cuyahoga County with nearby schools including Artemus Ward School, Almira Academy, and Anton Grdina School.
Ownership History
Date
Name
Owned For
Owner Type
Purchase Details
Closed on
May 28, 2003
Sold by
Mcnally Mary J
Bought by
Sulzmann Kimberly and Dorsey Joseph E
Current Estimated Value
Home Financials for this Owner
Home Financials are based on the most recent Mortgage that was taken out on this home.
Original Mortgage
$103,200
Outstanding Balance
$45,600
Interest Rate
5.9%
Mortgage Type
Purchase Money Mortgage
Estimated Equity
$180,089
Purchase Details
Closed on
Jul 31, 1995
Sold by
Murphy Teresa M
Bought by
Mcnally Mary J
Home Financials for this Owner
Home Financials are based on the most recent Mortgage that was taken out on this home.
Original Mortgage
$85,000
Interest Rate
7.59%
Mortgage Type
New Conventional
Purchase Details
Closed on
Jul 10, 1984
Sold by
Clark Dan R
Bought by
Murphy Teresa M
Purchase Details
Closed on
Jan 21, 1977
Sold by
Popadak Andrew N
Bought by
Clark Dan R
Purchase Details
Closed on
Jan 1, 1975
Bought by
Popadak Andrew N
Create a Home Valuation Report for This Property
The Home Valuation Report is an in-depth analysis detailing your home's value as well as a comparison with similar homes in the area
Home Values in the Area
Average Home Value in this Area
Purchase History
| Date | Buyer | Sale Price | Title Company |
|---|---|---|---|
| Sulzmann Kimberly | $129,000 | City Title Company | |
| Mcnally Mary J | $94,500 | -- | |
| Murphy Teresa M | $55,000 | -- | |
| Clark Dan R | $35,500 | -- | |
| Popadak Andrew N | -- | -- |
Source: Public Records
Mortgage History
| Date | Status | Borrower | Loan Amount |
|---|---|---|---|
| Open | Sulzmann Kimberly | $103,200 | |
| Previous Owner | Mcnally Mary J | $85,000 | |
| Closed | Sulzmann Kimberly | $25,800 |
Source: Public Records
Tax History Compared to Growth
Tax History
| Year | Tax Paid | Tax Assessment Tax Assessment Total Assessment is a certain percentage of the fair market value that is determined by local assessors to be the total taxable value of land and additions on the property. | Land | Improvement |
|---|---|---|---|---|
| 2024 | $4,103 | $62,580 | $12,705 | $49,875 |
| 2023 | $3,887 | $51,250 | $10,260 | $40,990 |
| 2022 | $3,865 | $51,240 | $10,260 | $40,990 |
| 2021 | $3,826 | $51,240 | $10,260 | $40,990 |
| 2020 | $3,404 | $39,410 | $7,880 | $31,540 |
| 2019 | $3,148 | $112,600 | $22,500 | $90,100 |
| 2018 | $3,074 | $39,410 | $7,880 | $31,540 |
| 2017 | $3,036 | $36,820 | $6,930 | $29,890 |
| 2016 | $3,013 | $36,820 | $6,930 | $29,890 |
| 2015 | $2,748 | $36,820 | $6,930 | $29,890 |
| 2014 | $2,748 | $33,460 | $6,300 | $27,160 |
Source: Public Records
Map
Nearby Homes
- 2263 Warren Rd
- 2230 Alger Rd
- 2209 Alger Rd
- 14428 Delaware Ave
- 14426 Alger Rd
- 14924 Delaware Ave
- 14926 Esther Ave
- 14909 Arden Ave
- 14404 Bayes Ave
- 14104 Hazelmere Ave
- 14924 Arden Ave
- 14031 Lakewood Heights Blvd
- 14328 Adrian Ave
- 32743 Warren Rd Unit 19
- 32742 Warren Rd Unit 18
- 2165 Arthur Ave
- 15615 Fernway Ave
- 2233 Bunts Rd
- 2078 Baxterly Ave
- 3255 W 140th St
- 14720 Fernway Ave
- 14728 Fernway Ave
- 14716 Fernway Ave
- 14732 Fernway Ave
- 14736 Fernway Ave
- 3080 Warren Rd
- 3086 Warren Rd
- 14740 Fernway Ave
- 14723 Fernway Ave
- 14727 Fernway Ave
- 14719 Fernway Ave
- 14737 Fernway Ave
- 14748 Fernway Ave
- 14733 Fernway Ave
- 14715 Fernway Ave
- 1 Warren Unit 1
- 4 Warren
- 3 Warren
- 2 Warren
- 3094 Warren Rd